Right Number, Wrong Blame
A post went viral this week. We checked it against the government's own numbers.
The post
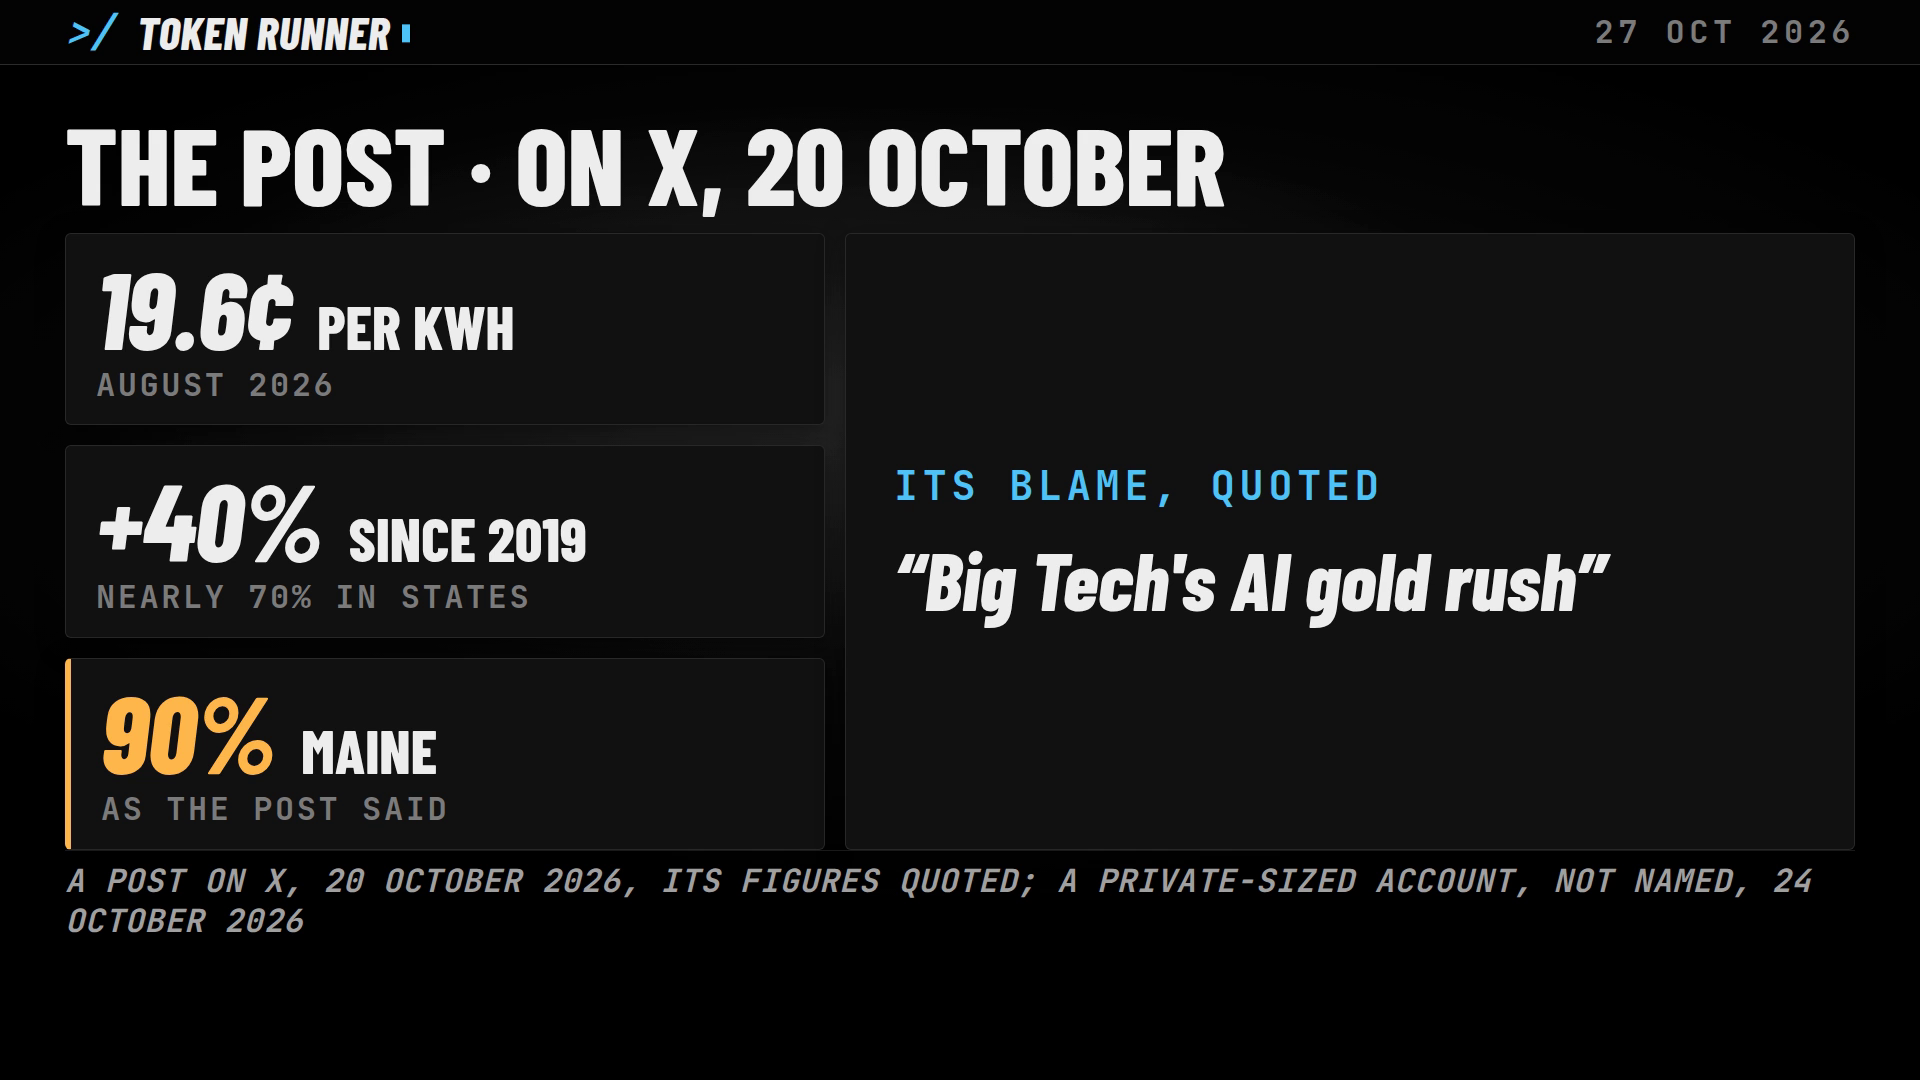
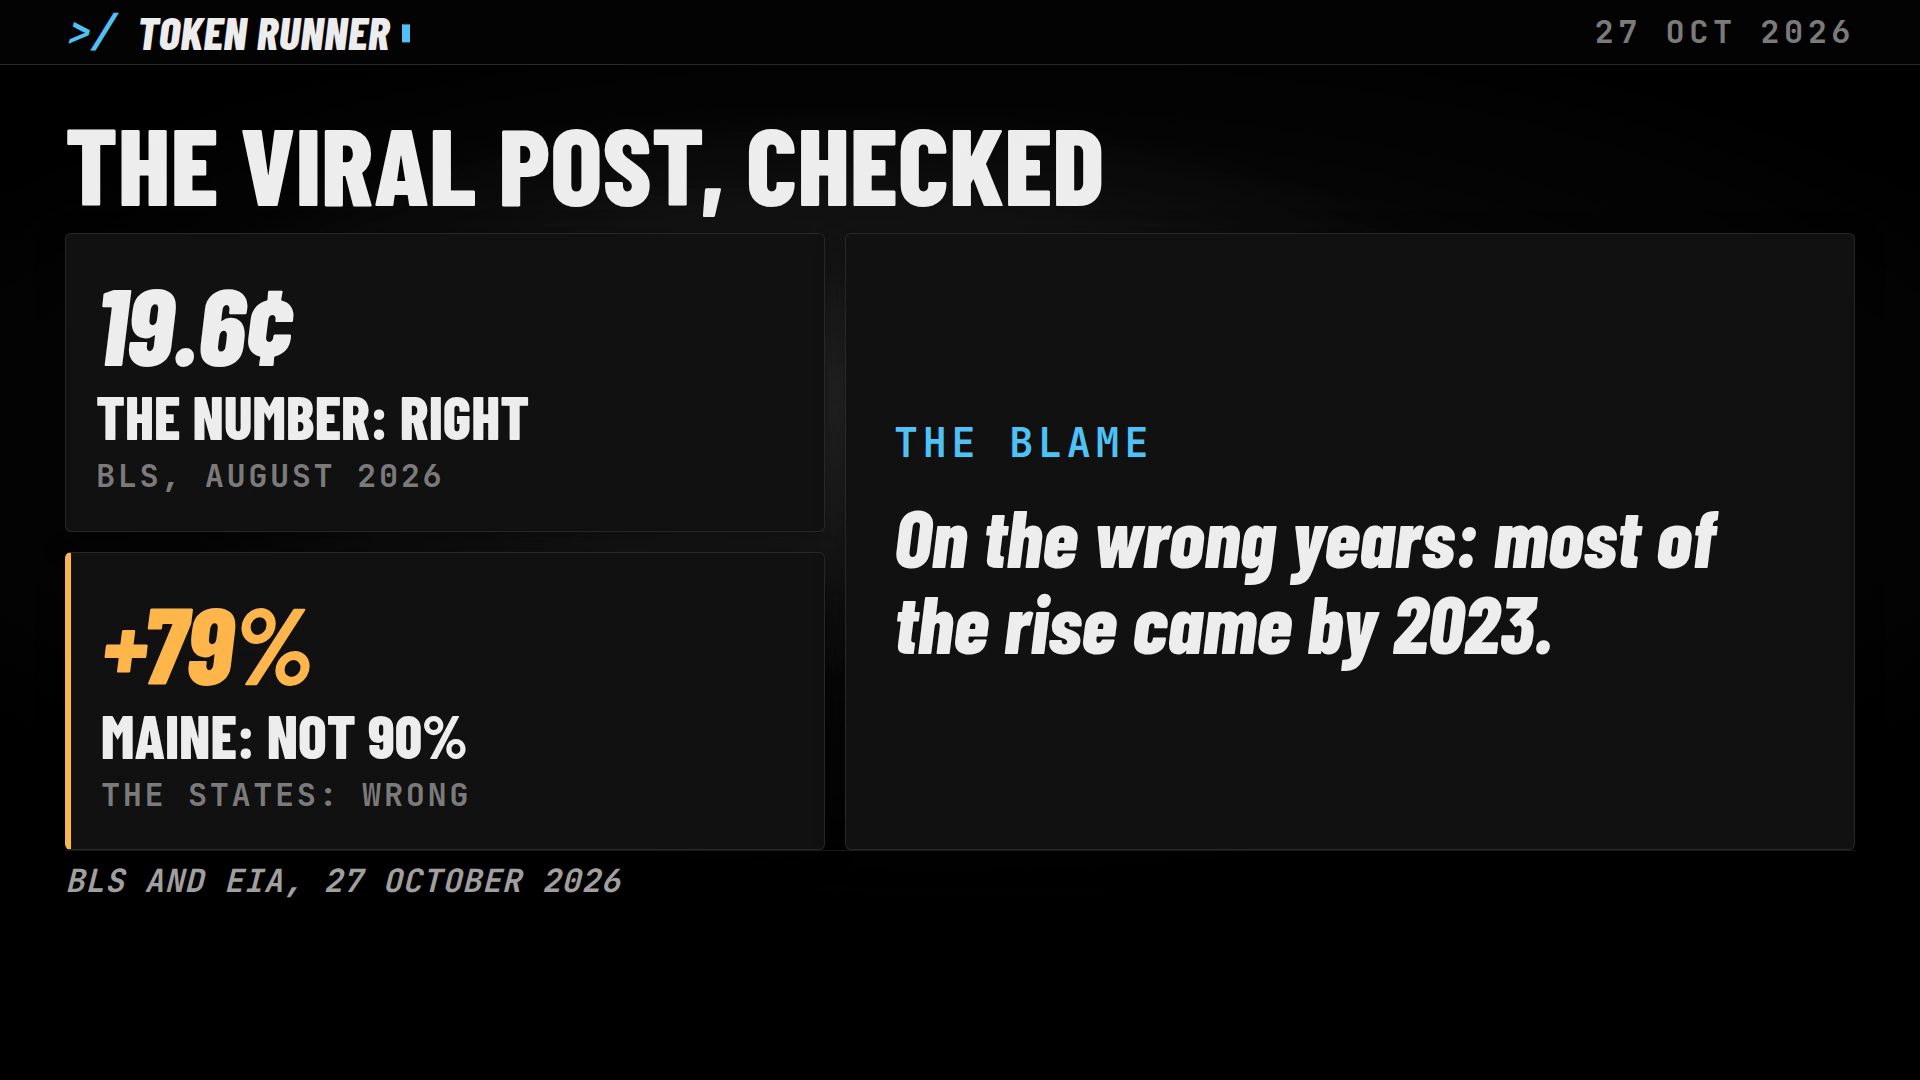
A viral post said American electricity now costs 19.6 cents a kilowatt-hour and that AI did it. The number is the government's own, to the digit. The state figures are not, and the timing does not fit the blame: most of the rise since 2019 had come by 2023, before the data-centre build-out.
The post went up on X on 20 October 2026 from a private-sized account, so it is not named here. It put four figures on the table: "hitting 19.6¢ per kWh in August 2026", "40% higher than in 2019", "nearly 70%" for California and New York, and "90%" for Maine. It laid the rise at the door of "Big Tech's AI gold rush".
Two agencies publish the price of residential electricity in the United States, by different methods. We checked each figure against both, and the blame against the years.
Two agencies, two methods
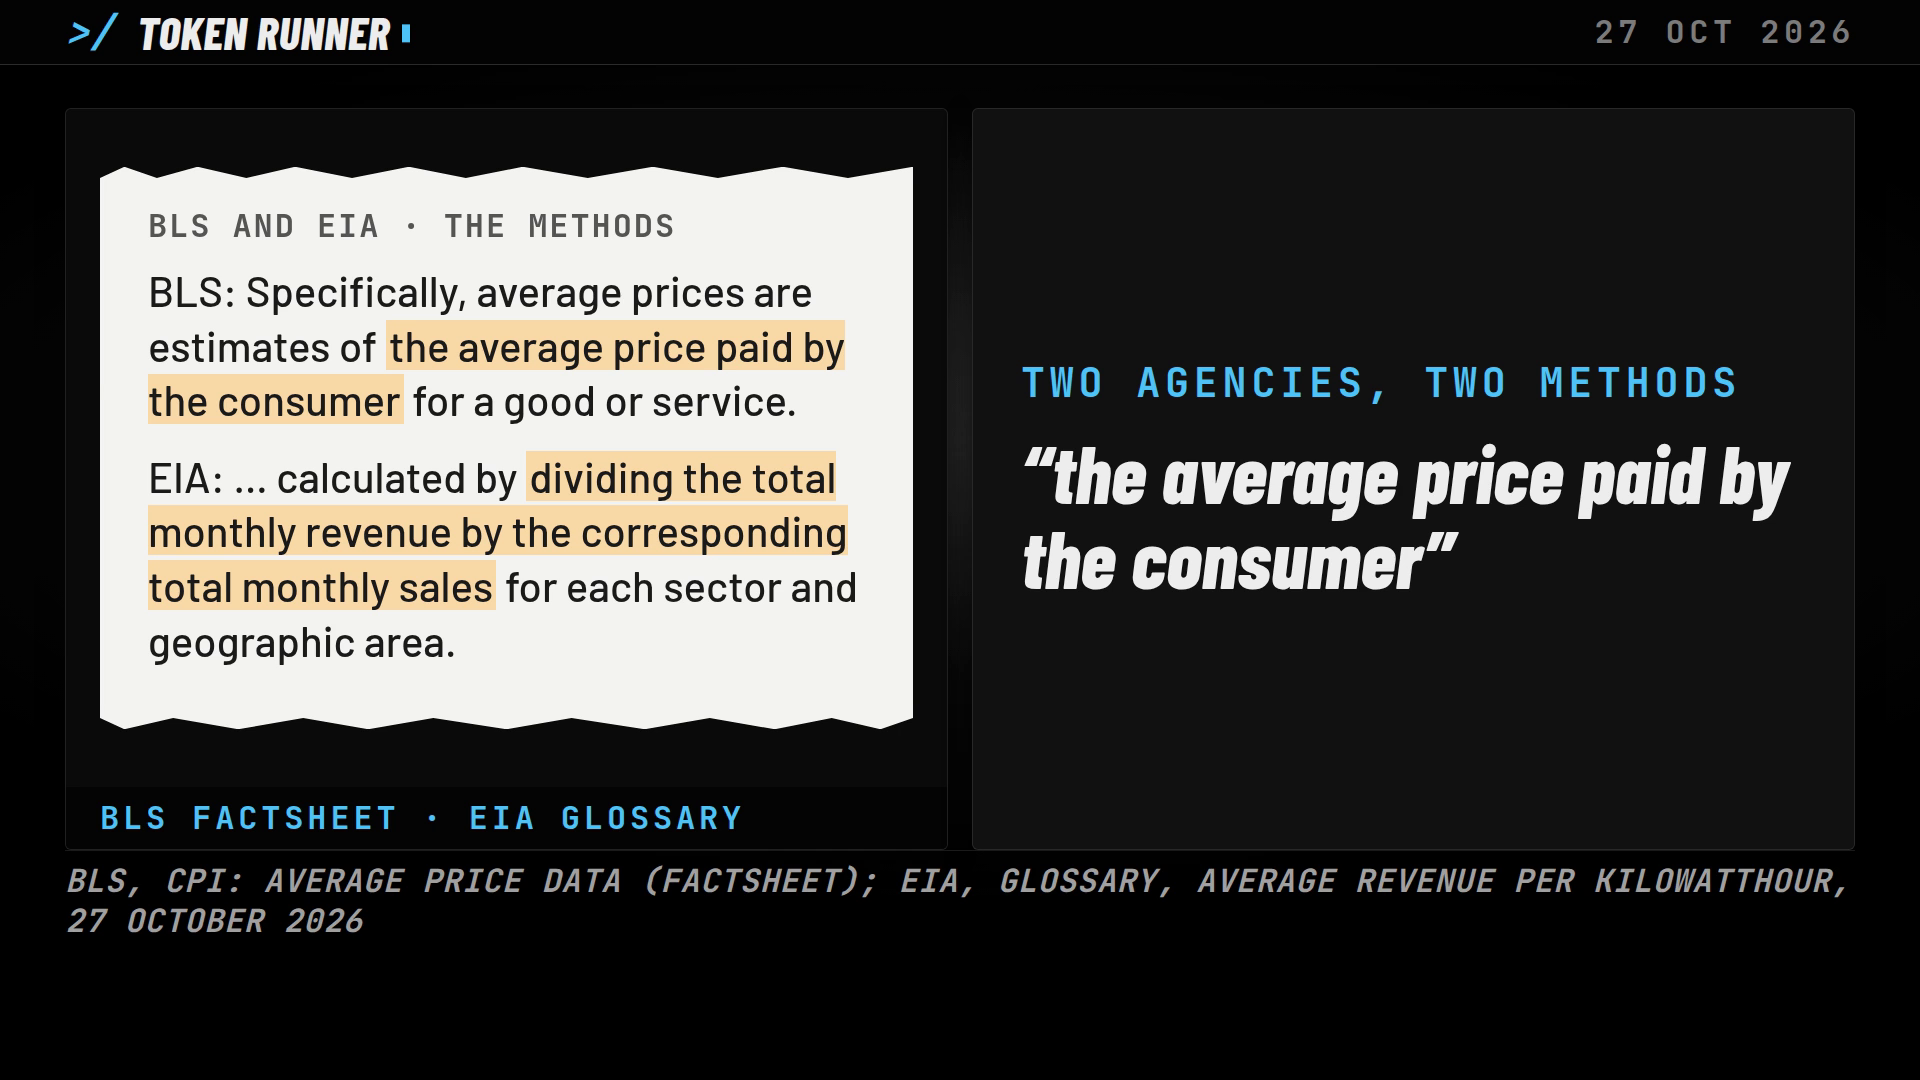
The Bureau of Labor Statistics tracks what city households pay. Its series comes from the consumer price index's sample of urban households, and its name says "U.S. city average".
The Energy Information Administration counts every residential customer in the fifty states and the District of Columbia. Its price is revenue divided by sales, from the utilities' own monthly reports: "calculated by dividing the total monthly revenue by the corresponding total monthly sales for each sector and geographic area".
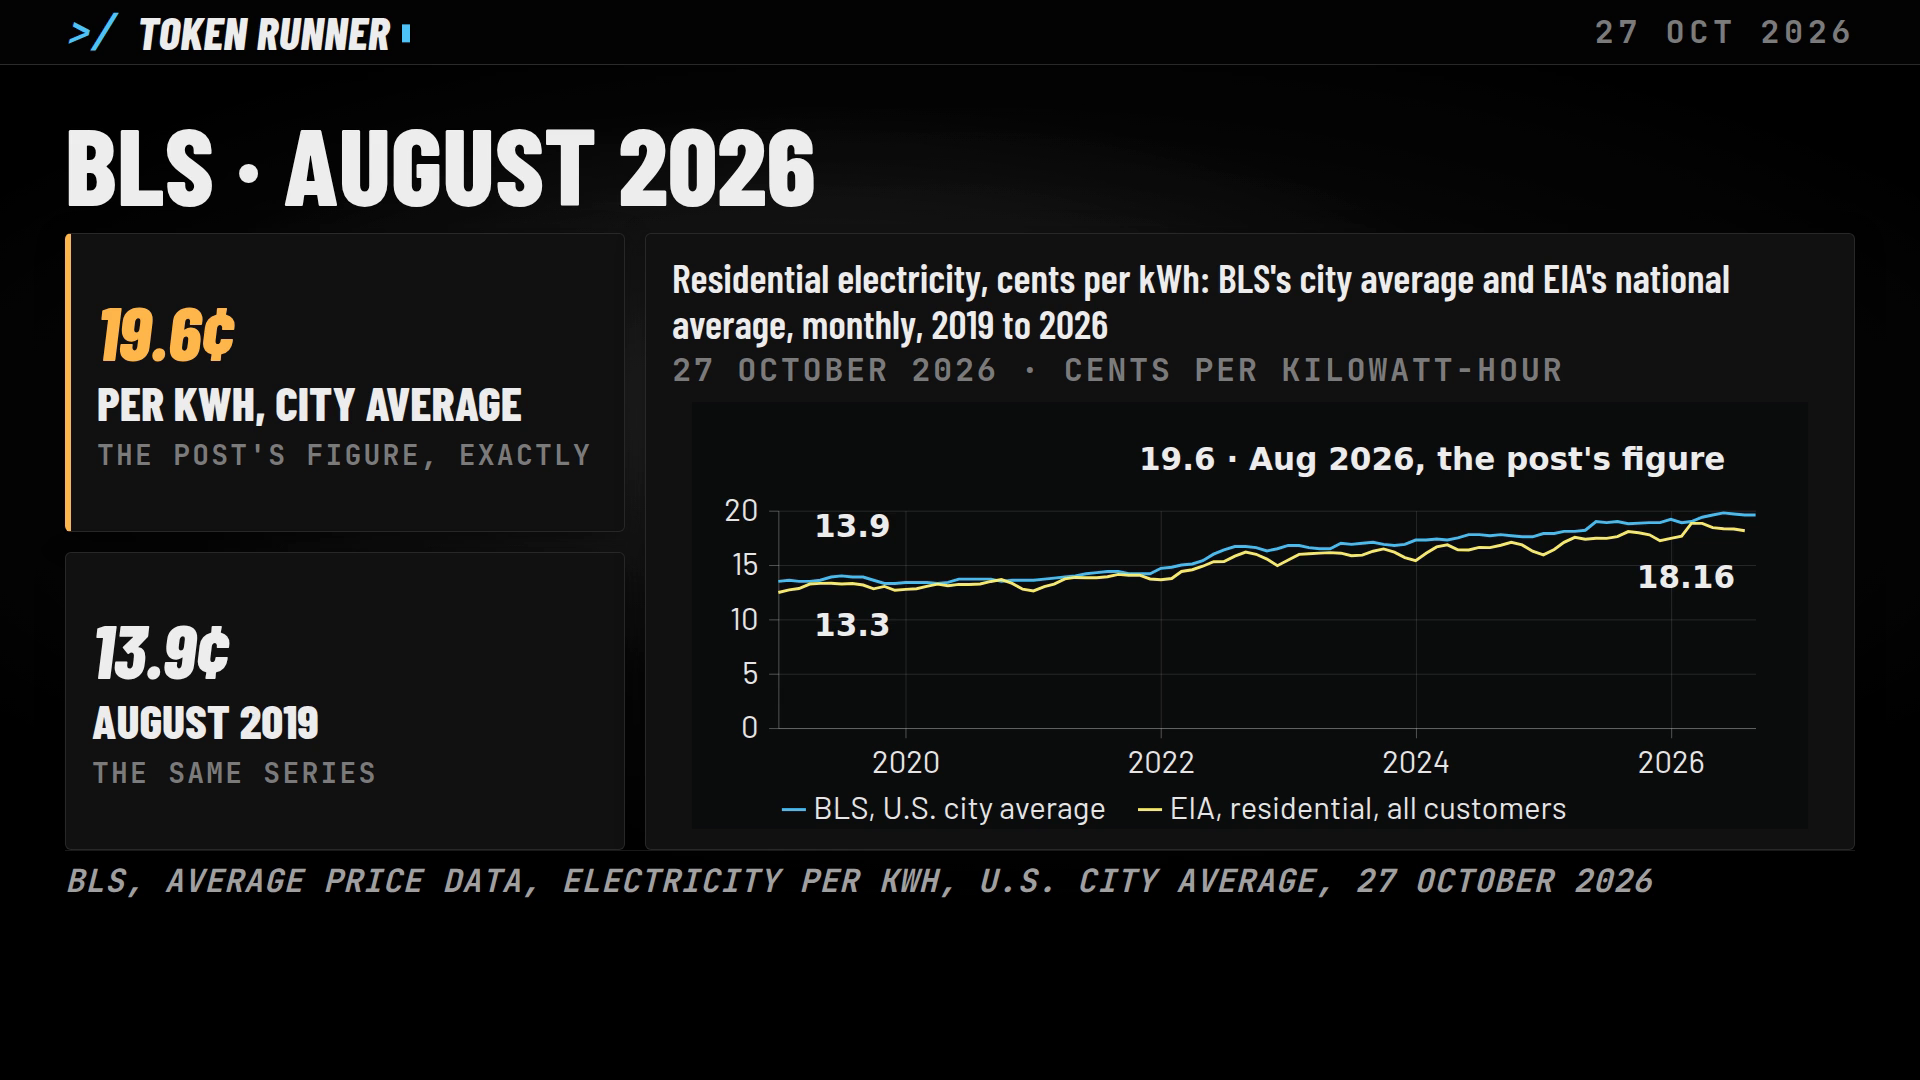
For August 2026 the Bureau's figure is $0.196 per kilowatt-hour, and so is September's. The Energy Information Administration's August figure is 18.16 cents, a preliminary estimate in its own words. Different methods. Both real.
Source: BLS, Average Price Data, series APU000072610 (the public API v2, read 27 October 2026); EIA, API v2 electricity/retail-sales (the pipeline's records of 19 October 2026); EIA, Electric Power Monthly, Tables 5.3 and 5.6.A (published 27 October 2026); a post on X of 20 October 2026 (the poster not named)
The number is right
So the headline number is right. The post's 19.6 cents is the Bureau of Labor Statistics' own figure for August 2026.
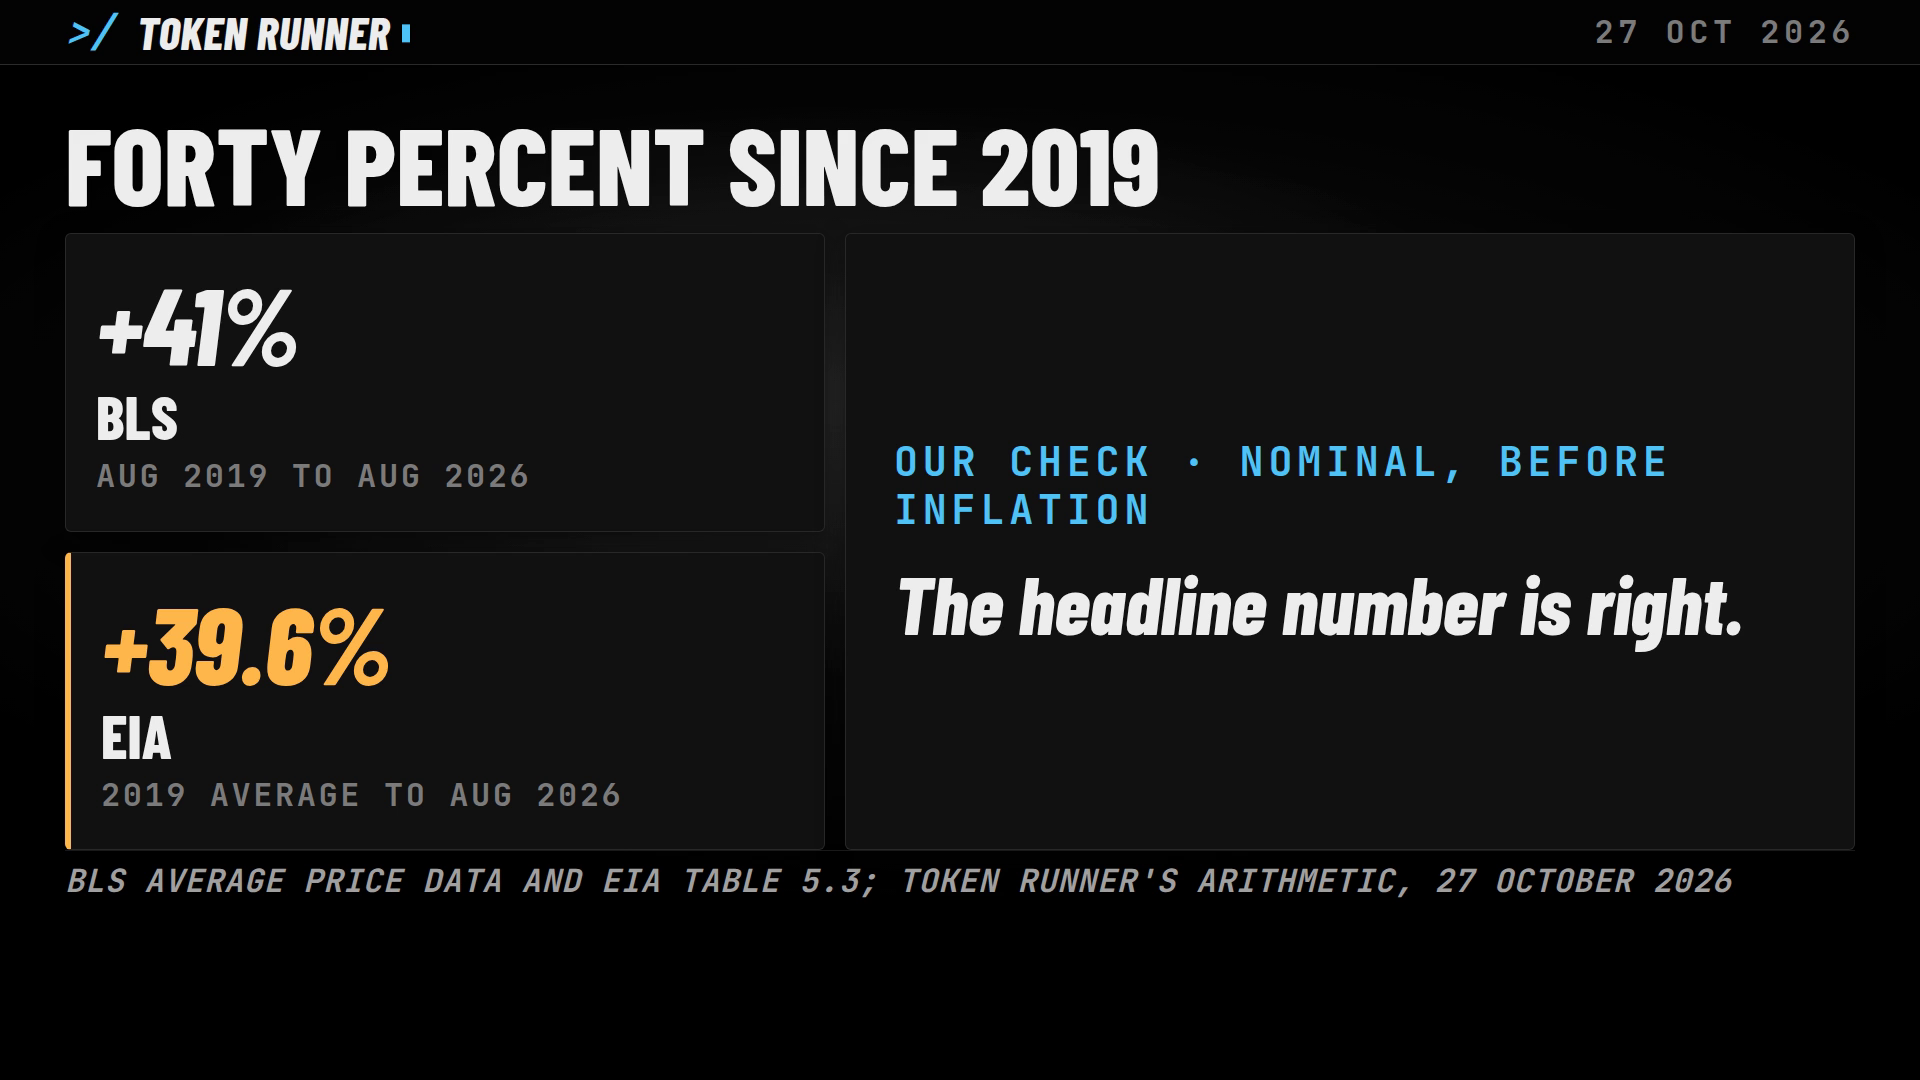
Its forty per cent since 2019 holds on both series, before inflation. The Bureau's August 2019 price was 13.9 cents; August 2026 is 41.0 per cent more, our arithmetic. The Energy Information Administration's 18.16 cents for August 2026 is 39.6 per cent more than its 2019 annual average of 13.01, a month set against a year.
The two agencies measure different things, a sample of city households and the whole residential market, and arrive at the same rise. Both comparisons are in the money of their day, not adjusted for inflation.
August by August, the Bureau's series reads 13.9 cents in 2019, 16.7 in 2022, 17.0 in 2023, 17.7 in 2024, 19.0 in 2025 and 19.6 in 2026. The post's headline is the last of those.
The states
The states are another matter. Maine is up 79 per cent, not 90. California is up 50 and New York 56, not nearly 70.
Source: BLS, Average Price Data, series APU000072610 (the public API v2, read 27 October 2026); EIA, API v2 electricity/retail-sales (the pipeline's records of 19 October 2026); EIA, Electric Power Monthly, Tables 5.3 and 5.6.A (published 27 October 2026); a post on X of 20 October 2026 (the poster not named)
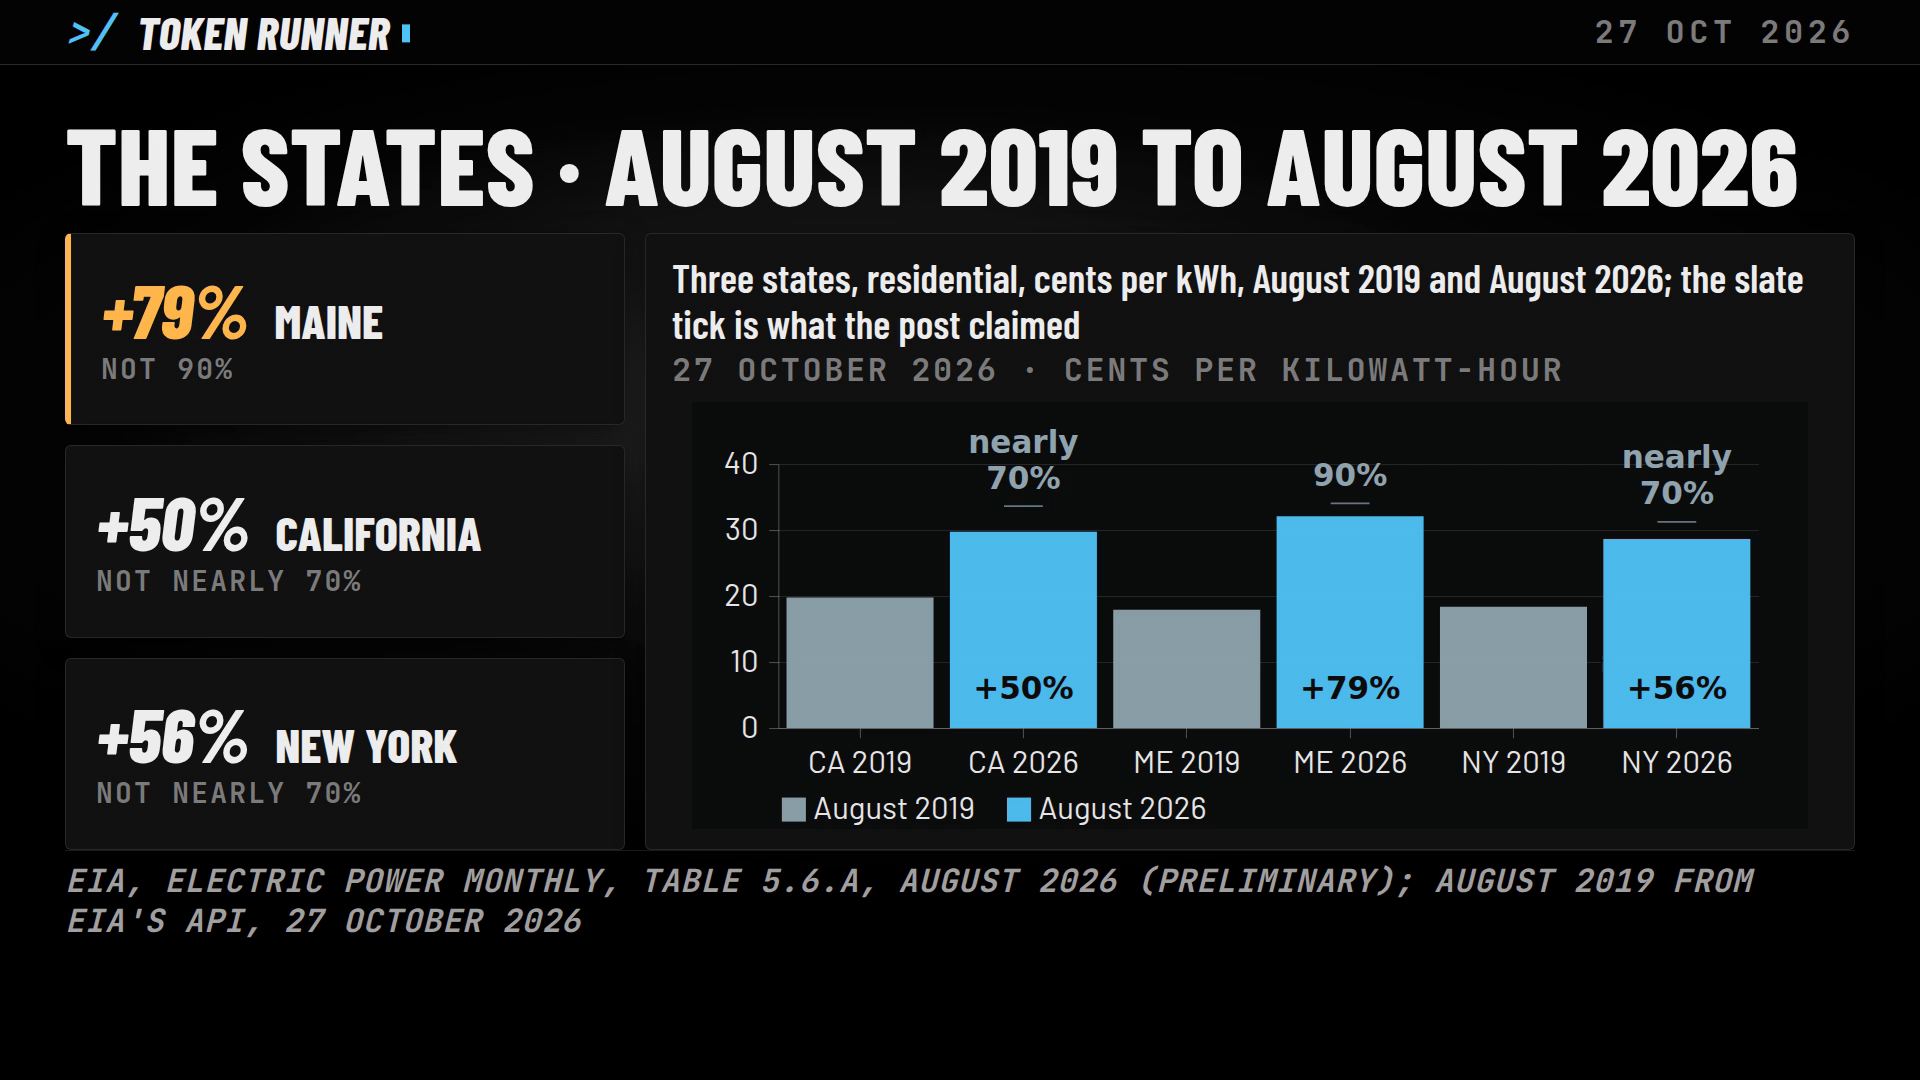
The Energy Information Administration's Table 5.6.A gives each state's residential price for August 2026, preliminary: Maine 32.11 cents per kilowatt-hour, California 29.75, New York 28.65, the United States 18.16. The same agency's published data for August 2019 give Maine 17.92, California 19.78, New York 18.38 and the United States 13.30.
August 2026 against August 2019, our arithmetic: Maine up 79 per cent, California up 50, New York up 56, the country up 37. Big rises, and nominal. Just not the ones in the post.
The year before tells its own story. In August 2025, final figures, Maine was at 28.14 cents, New York at 26.64 and California at 30.92. California's price was lower in August 2026 than a year earlier, on the agency's preliminary figure.
Now the blame
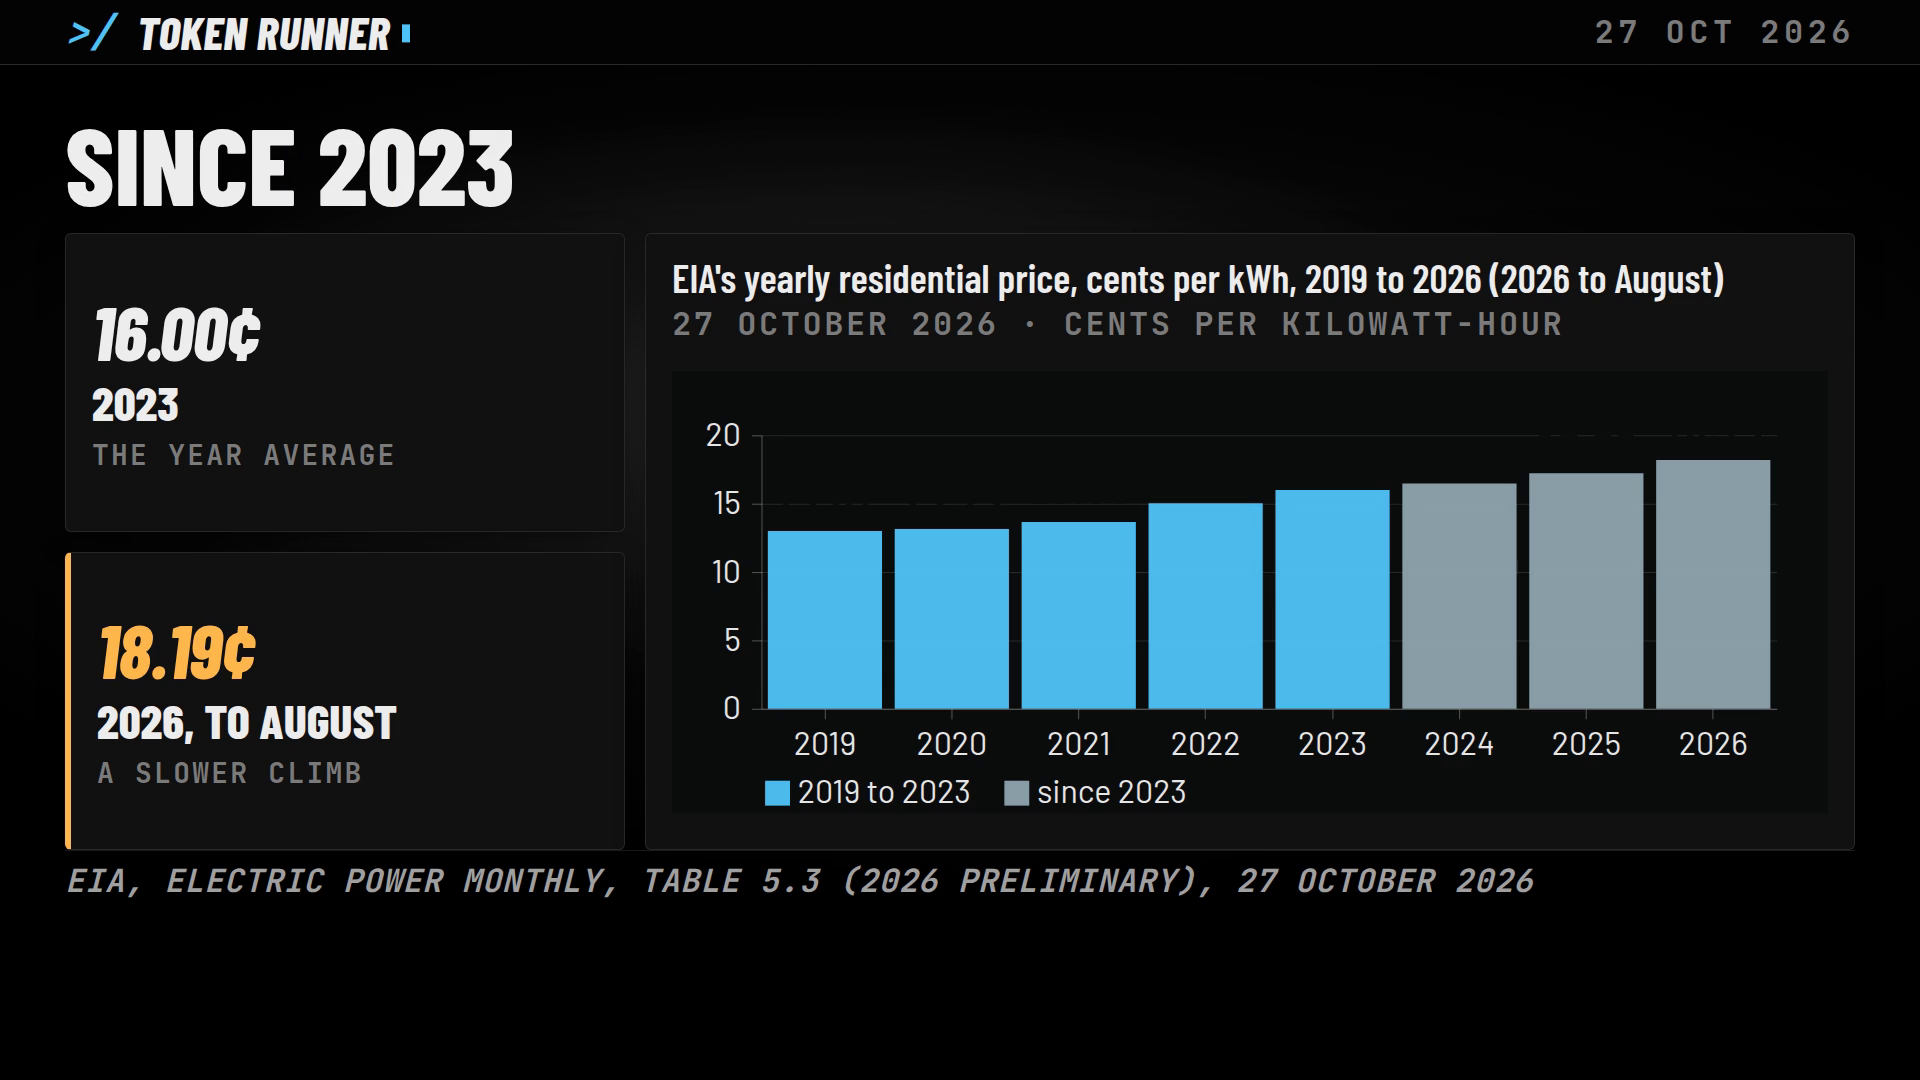
On the Energy Information Administration's yearly numbers, the price climbed from 13 cents in 2019 to 16 by 2023. That is most of the rise, and it came before the data-centre build-out of the last three years. Since 2023 the climb has been slower: 16 to 18.
Source: BLS, Average Price Data, series APU000072610 (the public API v2, read 27 October 2026); EIA, API v2 electricity/retail-sales (the pipeline's records of 19 October 2026); EIA, Electric Power Monthly, Tables 5.3 and 5.6.A (published 27 October 2026); a post on X of 20 October 2026 (the poster not named)
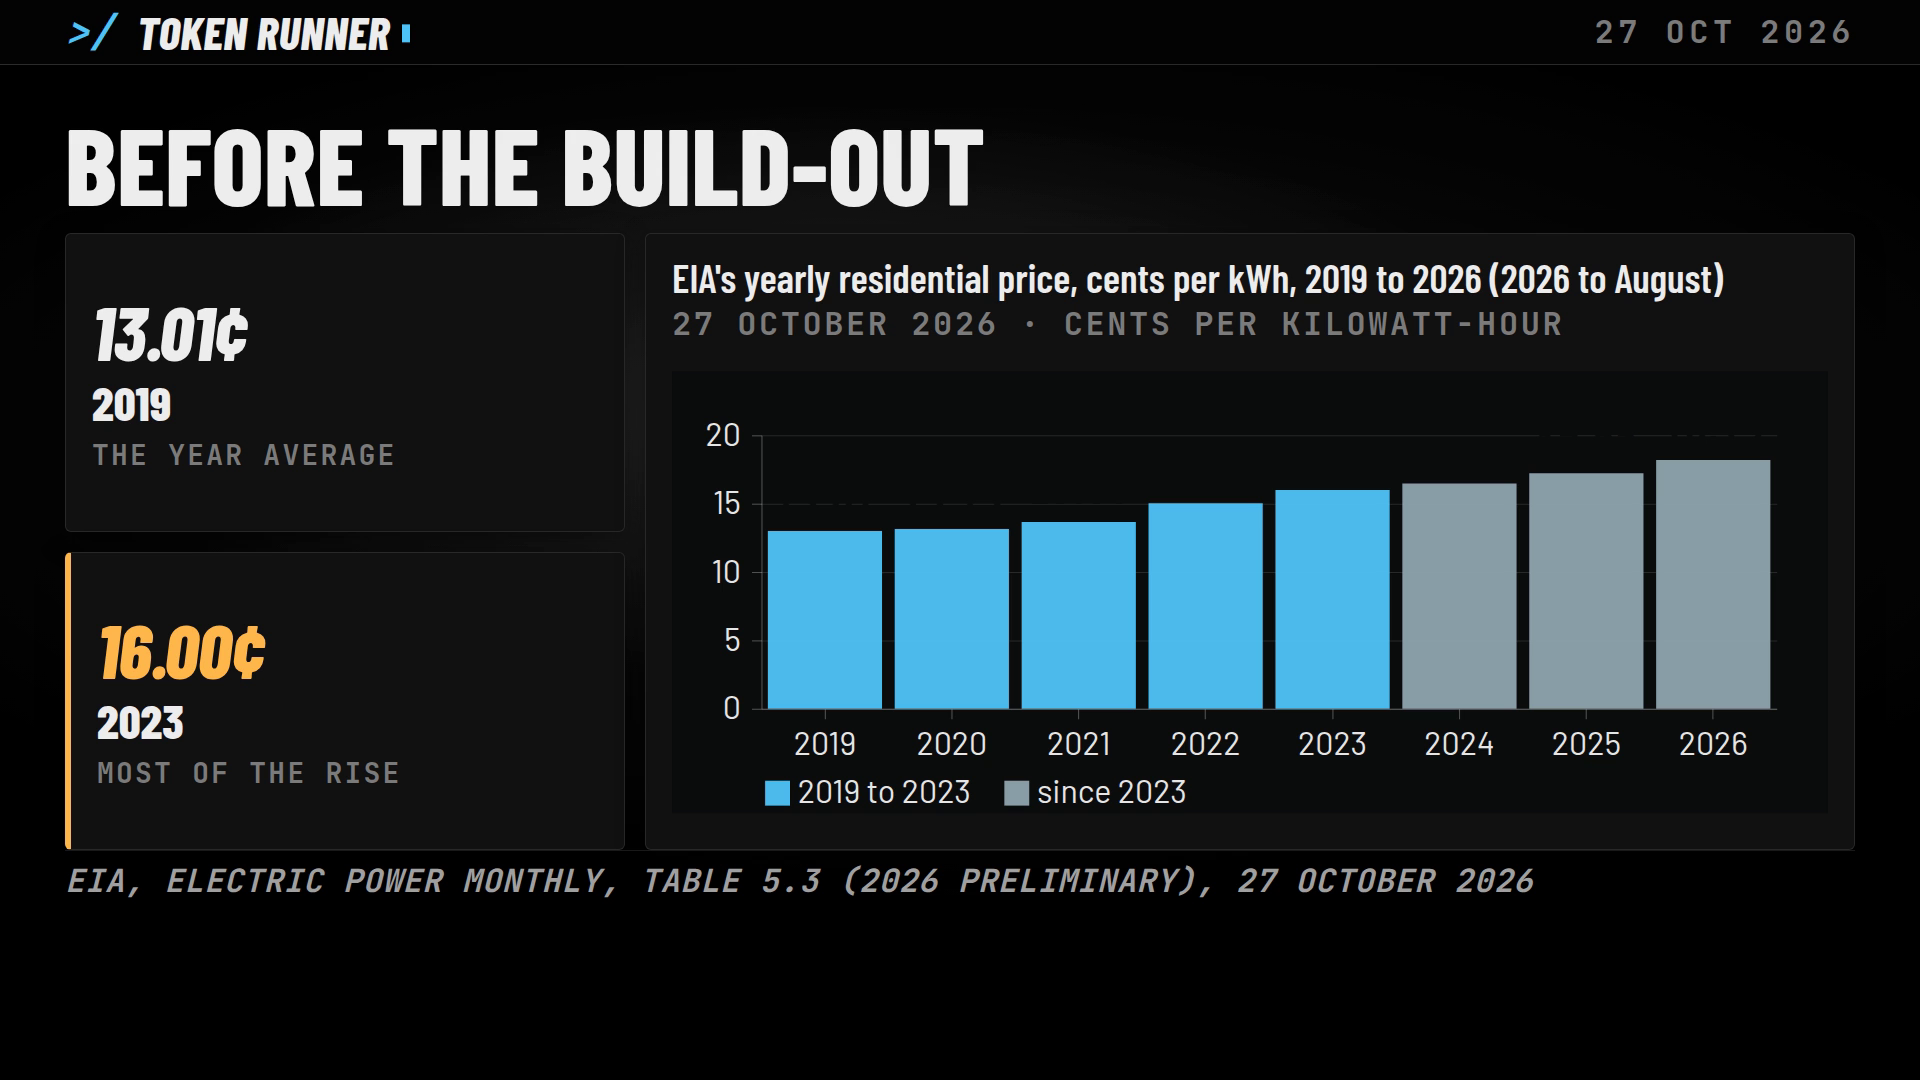
Table 5.3 gives the residential price as a yearly average: 13.01 cents in 2019, 13.15 in 2020, 13.66 in 2021, 15.04 in 2022, 16.00 in 2023, 16.48 in 2024, 17.23 in 2025, and 18.19 for the first eight months of 2026, preliminary.
From 2019 to 2023 the price rose 2.99 cents. From 2023 to the 2026 figure it rose 2.19 cents more. So 2.99 of the 5.18 cents of rise since 2019, about 58 per cent, had come by 2023, our arithmetic on the agency's figures. The table states no cause for any of it, and this piece names none: it says when the rise came, not why.
Before 2019 the price barely moved: 12.55 cents in 2016, 12.89 in 2017 and 12.87 in 2018. The steepest single year in the table is 2022, from 13.66 cents to 15.04, our arithmetic.
To be fair
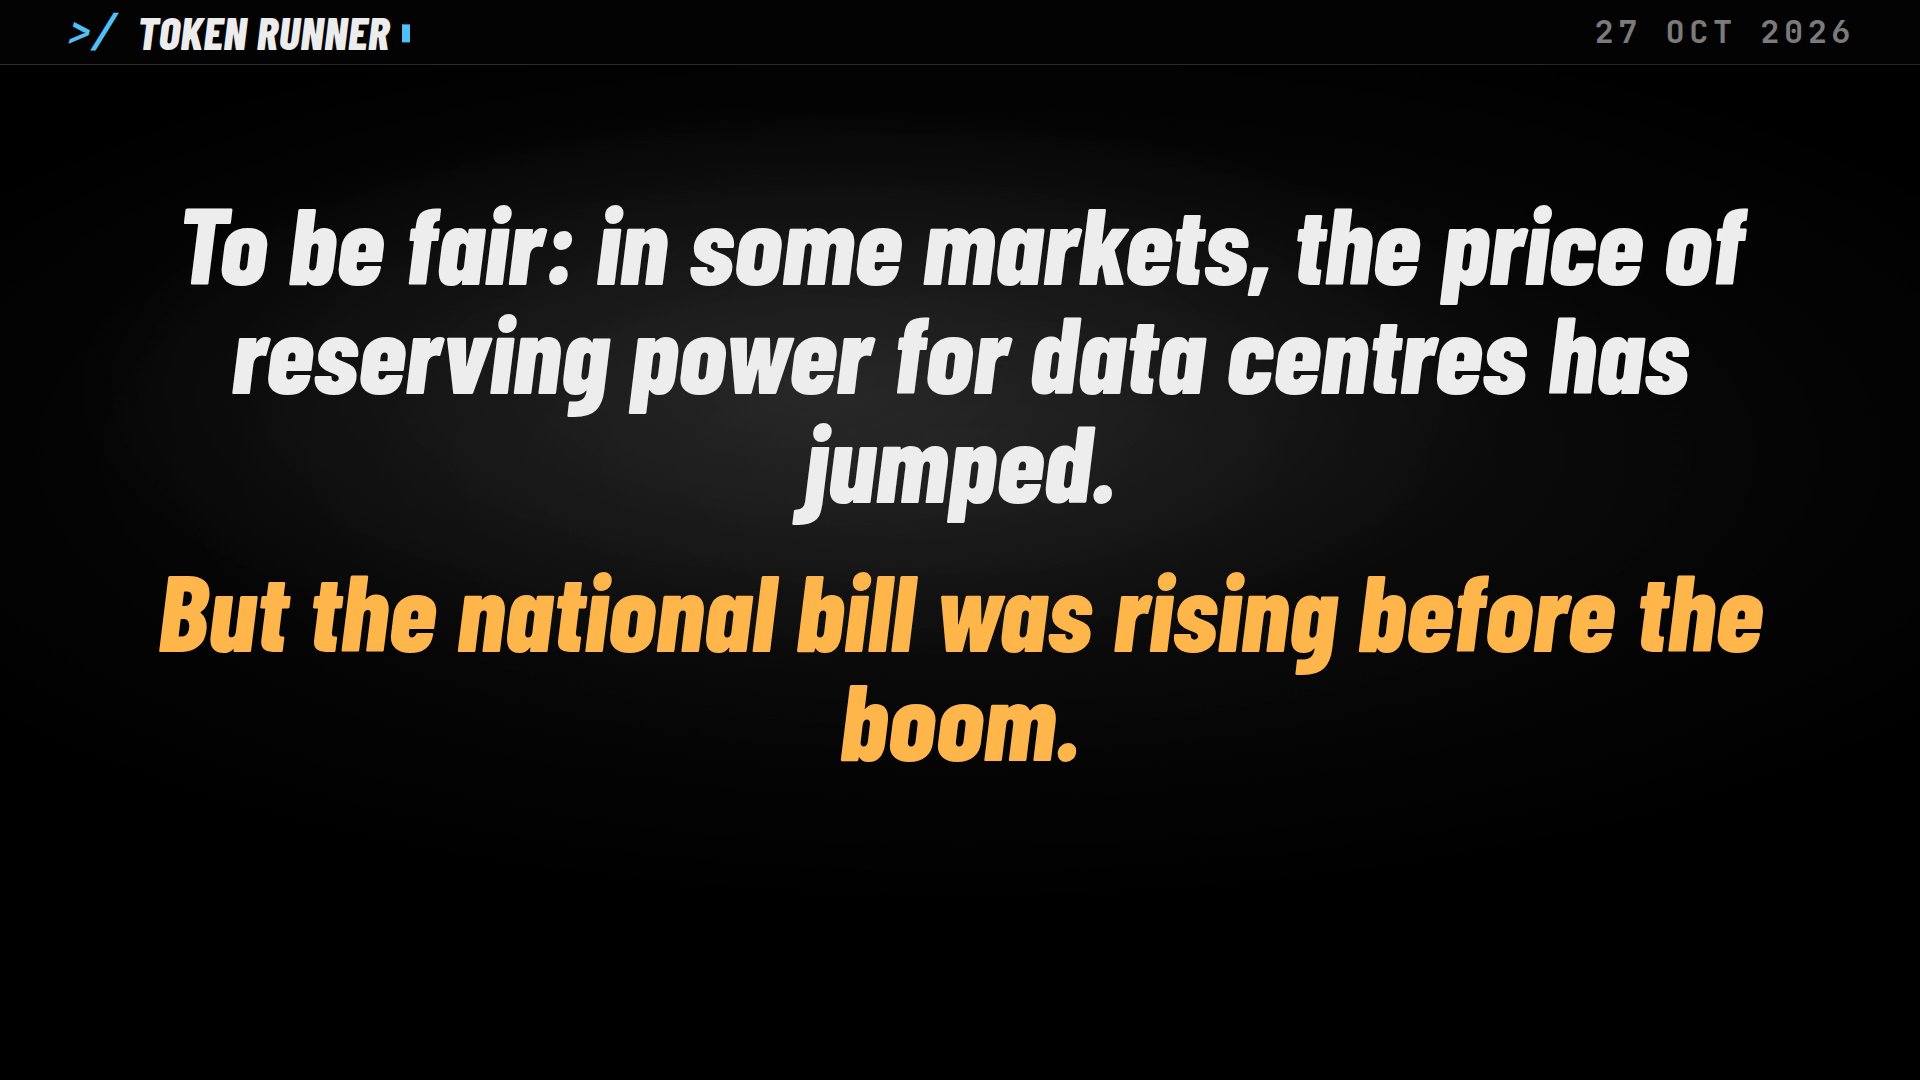
Data centres do show up in power prices. In some markets the price of reserving power for them has jumped, and we have covered it.
That price is set in PJM's capacity auction, which this site followed in Who Pays for the Power?. It is a market-by-market story.
But the national bill was rising before the boom. The national residential price in the agency's yearly series was already up 2.99 cents between 2019 and 2023. Neither agency's table says what moved it, and this piece does not either. Prices here are nominal, and the 2026 figures are the agency's preliminary estimates.
Checked
So the viral post got the number right.
It got the states wrong. And it put the blame on the wrong years.
What to watch: the Energy Information Administration's final figures for 2026, which replace the preliminary ones, and the next capacity auctions in the markets where data centres are reserving power.
Every figure from the Bureau of Labor Statistics and the Energy Information Administration.
Sources
- Bureau of Labor Statistics, Average Price Data, series APU000072610, "Electricity per KWH in U.S. city average", read through the BLS public API v2 on 27 October 2026: 93 monthly observations from January 2019 to September 2026, in dollars per kilowatt-hour; August 2026 0.196, September 2026 0.196, August 2019 0.139. The viral post's 19.6 cents is this series' August 2026 figure.
- Bureau of Labor Statistics, "CPI: Average Price Data" (factsheet): "Specifically, average prices are estimates of the average price paid by the consumer for a good or service."; "Average prices are estimated from a subset of CPI data"; "the CPI sample is optimized for the calculation of price indexes, not for the calculation of average prices."; "Electricity prices are reported in kilowatt hours (kwh)."
- Energy Information Administration, Electric Power Monthly, Table 5.3, "Average Price of Electricity to Ultimate Customers: Total by End-Use Sector, 2016 - August 2026 (Cents per Kilowatthour)", read 27 October 2026. Residential, annual: 2019 13.01; 2020 13.15; 2021 13.66; 2022 15.04; 2023 16.00; 2024 16.48; 2025 17.23; 2026 year to date (January to August) 18.19. Residential, August 2026: 18.16; August 2025: 17.57. "Values for 2025 and prior years are final."; "Values for 2026 are preliminary estimates based on a cutoff model sample."; source Form EIA-861M.
- Energy Information Administration, Electric Power Monthly, Table 5.6.A, "Average Price of Electricity to Ultimate Customers by End-Use Sector, by State, August 2026 and 2025 (Cents per Kilowatthour)", residential, read 27 October 2026: Maine 32.11 (August 2025: 28.14); California 29.75 (30.92); New York 28.65 (26.64); U.S. total 18.16 (17.57). "Values for 2025 are final. Values for 2026 are preliminary estimates based on a cutoff model sample."
- Energy Information Administration, API v2, electricity/retail-sales, residential average price by state and for the U.S. total, monthly, as the pipeline's own record of 19 October 2026 holds it (data through July 2026): August 2019, Maine 17.92, California 19.78, New York 18.38, U.S. total 13.30 cents per kilowatt-hour; the U.S. residential series January 2019 to July 2026 drawn in the first chart.
- Energy Information Administration, Glossary, "Average revenue per kilowatthour": "The average revenue per kilowatthour of electricity sold by sector (residential, commercial, industrial, or other) and geographic area (State, Census division, and national) is calculated by dividing the total monthly revenue by the corresponding total monthly sales for each sector and geographic area."