Two Answers
Is AI taking young people's first jobs? Two research teams are tracking it, month by month. Their answers sound very different.
Stanford's answer
Is AI taking young people's first jobs? Stanford's payroll data finds 22-to-25-year-olds in the most AI-exposed jobs about 19 percent behind their less-exposed peers. Yale's survey data finds no clear footprint yet, and the two are not measuring the same thing.
Stanford's Digital Economy Lab reads payroll records, millions of them, from the payroll company ADP. For 22-to-25-year-olds in the jobs most exposed to AI, employment now stands about 19 percent below where it would be had it kept pace with their less-exposed peers.
A year earlier that gap was 15 percent. Experienced workers show no comparable gap.
Source: Stanford Digital Economy Lab (Erik Brynjolfsson, Bharat Chandar and Ruyu Chen), 'No Widespread Displacement, but the AI Employment Gap for Young Workers Has Widened to 19%', 12 August 2026, digitaleconomy.stanford.edu/news/canariesaug26/
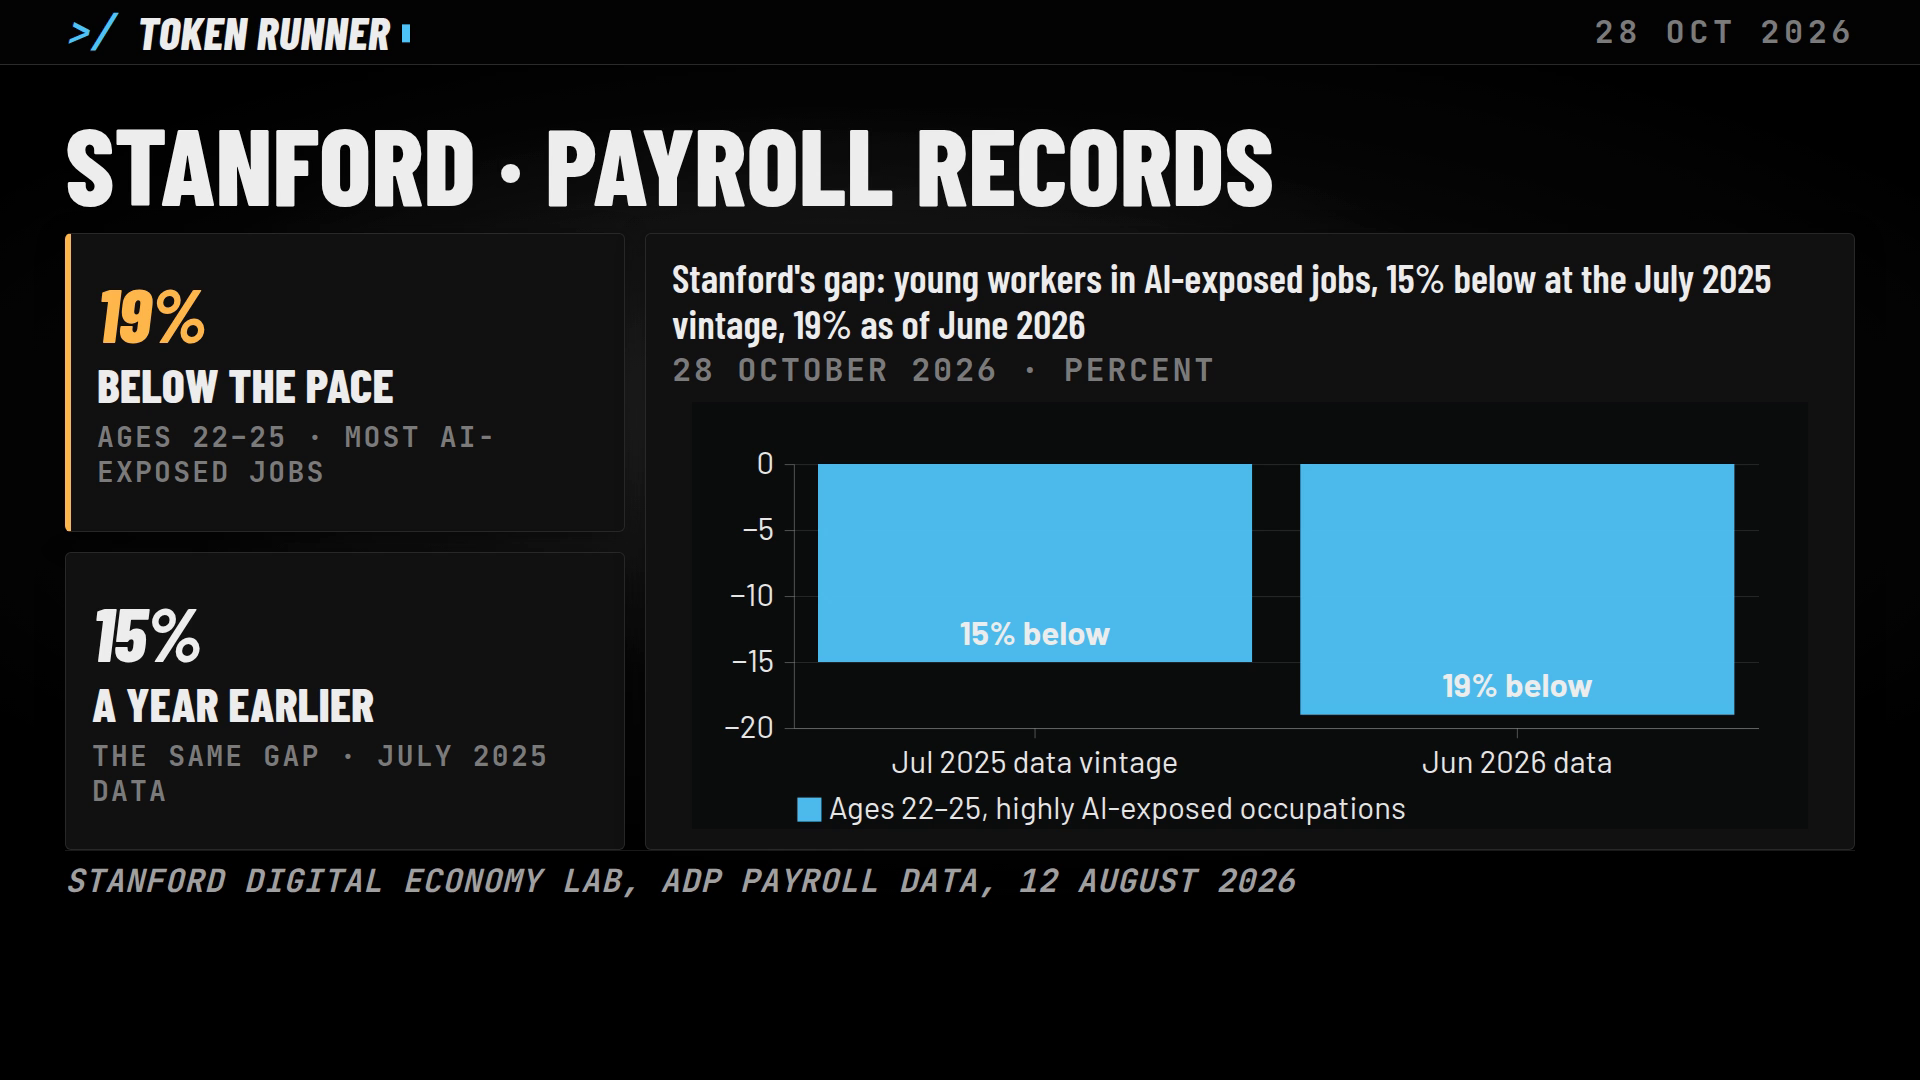
The lab's sentence, on its page of 12 August 2026: "Employment among workers ages 22–25 in highly AI-exposed occupations now stands about 19% below where it would be if it had kept pace with employment among similarly aged workers in less-exposed occupations. Experienced workers show no comparable gap." And: "the shortfall was 15% at the July 2025 data vintage and is 19% as of June 2026". The 19% is a shortfall against a kept-pace path, not a fall in jobs: in levels, the page's footnote says, employment of the age group in the two most exposed quintiles fell about 11% between November 2022 and June 2026, while in the three least-exposed quintiles it grew about 10%. The paper's data: ADP payroll records "covering millions of U.S. workers", between 3.5 and 5 million employees a month in the analysis sample.
The lab's small print
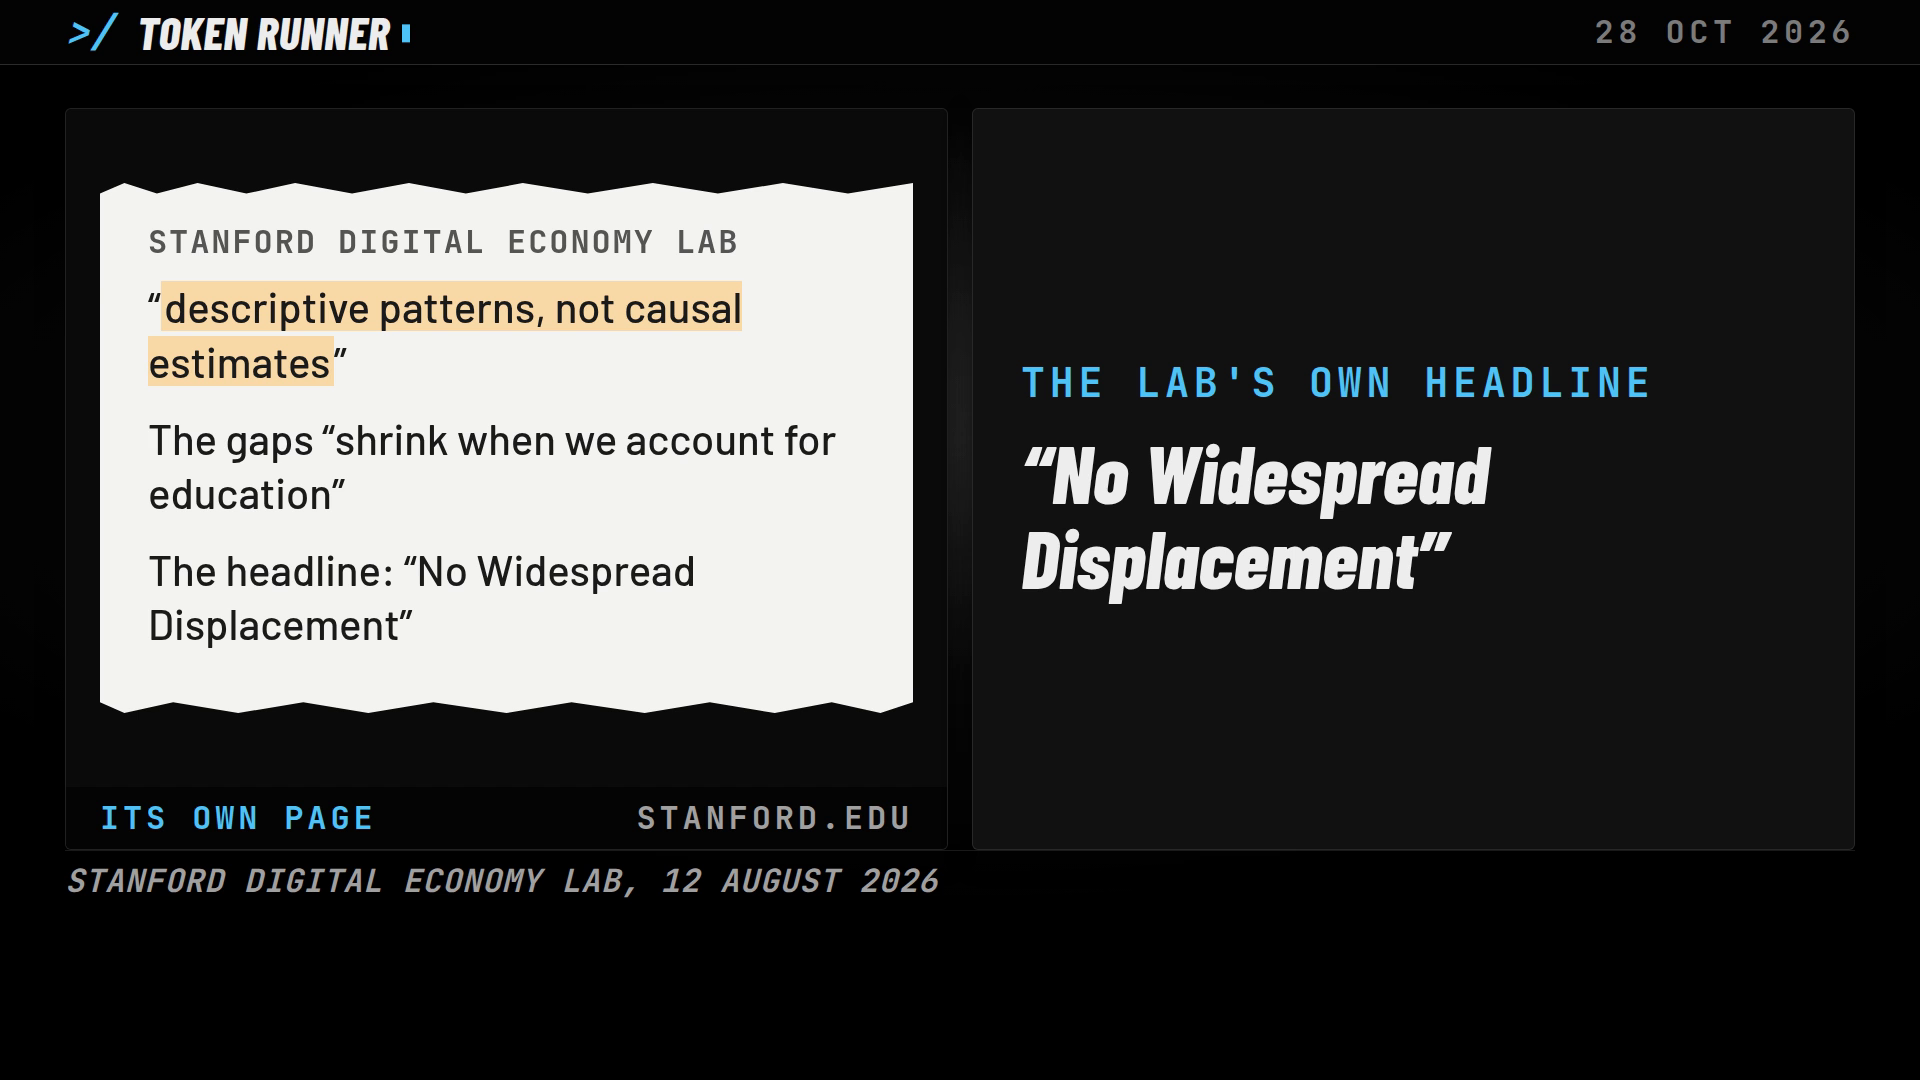
Read the lab's own small print. These are, in its words, "descriptive patterns, not causal estimates". The gaps "shrink when we account for education". And its headline begins: "No Widespread Displacement".
The page's sentences, whole: "These are descriptive patterns, not causal estimates of the effect of AI." "The gaps between more- and less-exposed young workers shrink when we account for education." The headline: "No Widespread Displacement, but the AI Employment Gap for Young Workers Has Widened to 19%". And the bridge to Yale: "The estimated gaps are also larger in the ADP analysis sample than in national survey benchmarks."
Yale's answer
Yale's Budget Lab asks the same question with different data: the government's monthly survey of households. Updated with September's data, its answer is no "clear evidence of labor market disruption associated with AI".
But, it adds, unemployment growth for AI-exposed workers "has tended to be elevated" against comparable unexposed workers since late 2022. In the third quarter of 2026 the difference was +1.1 percentage points.
Source: Yale Budget Lab, 'Tracking the Impact of AI on the Labor Market', the tracker's data (tools/ai-labor-market-tracker/data/comparisons/unemployment-rate/data.csv, github.com/Budget-Lab-Yale/budget-lab-interactives, main), read at source 28 October 2026
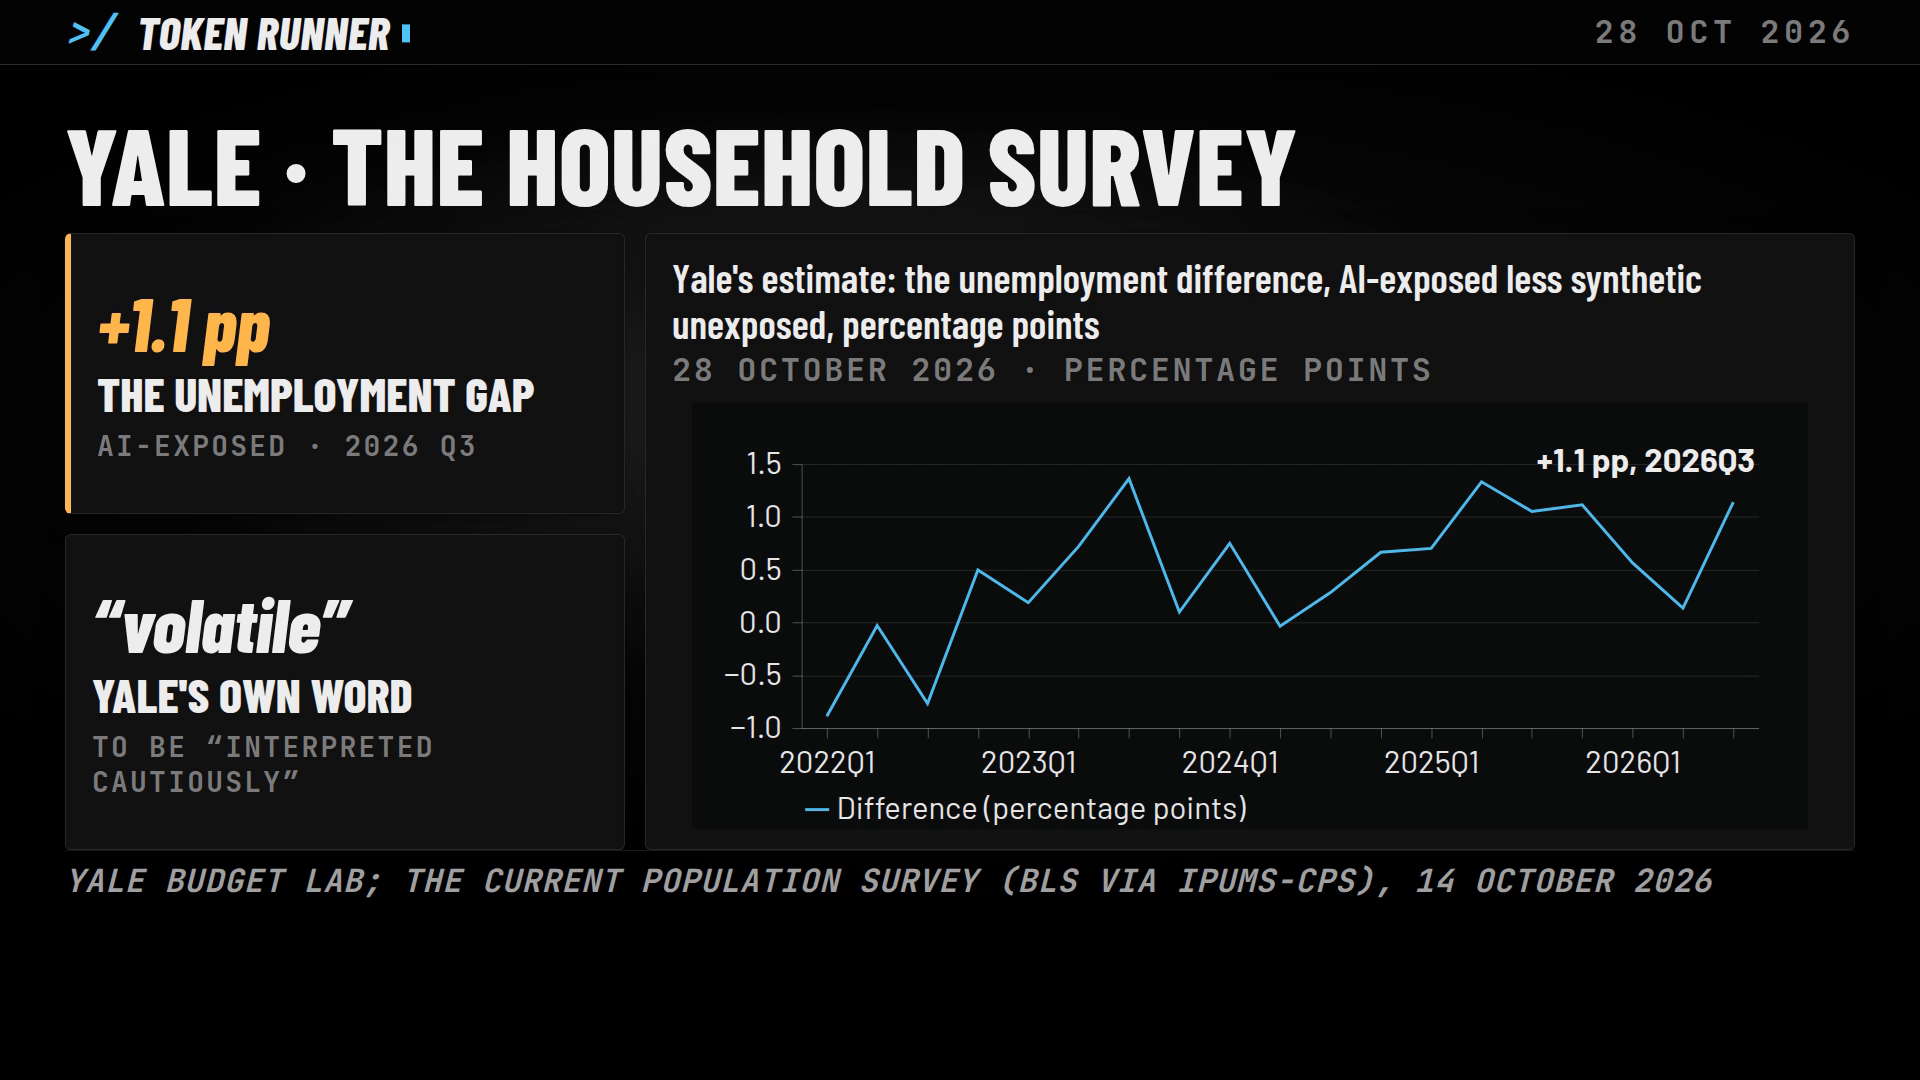
Yale's own words for it are "volatile", to be "interpreted cautiously".
The update of 14 October 2026, whole: "The Budget Lab's labor market analysis, updated to incorporate September 2026 CPS microdata, does not provide clear evidence of labor market disruption associated with AI." Then: "the growth in unemployment of AI-exposed workers has tended to be elevated relative to growth for comparable unexposed workers since late 2022, and this is the case in the third quarter of 2026. These estimates are volatile and should be interpreted cautiously, particularly as they are not accompanied by other indications of labor market impacts."
The tracker's own data file carries the comparison: the log unemployment rate of AI-exposed occupations against a synthetic unexposed match, and their difference by quarter. In the third quarter of 2026 the difference is +1.14 percentage points, with a 95% interval from −0.19 to +2.48, so it includes zero; it has been positive in 15 of the 16 quarters since late 2022 and outside zero in four of them.
Source: Yale Budget Lab, 'Tracking the Impact of AI on the Labor Market', the tracker's data (tools/ai-labor-market-tracker/data/comparisons/unemployment-rate/data.csv, github.com/Budget-Lab-Yale/budget-lab-interactives, main), read at source 28 October 2026
Why two answers
So why two answers? The labs differ three ways. Different data: payroll records against a household survey.
Different people: Stanford looks at the youngest workers, Yale at workers of all ages. And different lines: Stanford's "highly exposed" is the two most exposed fifths of occupations, Yale's exposed group the top third.
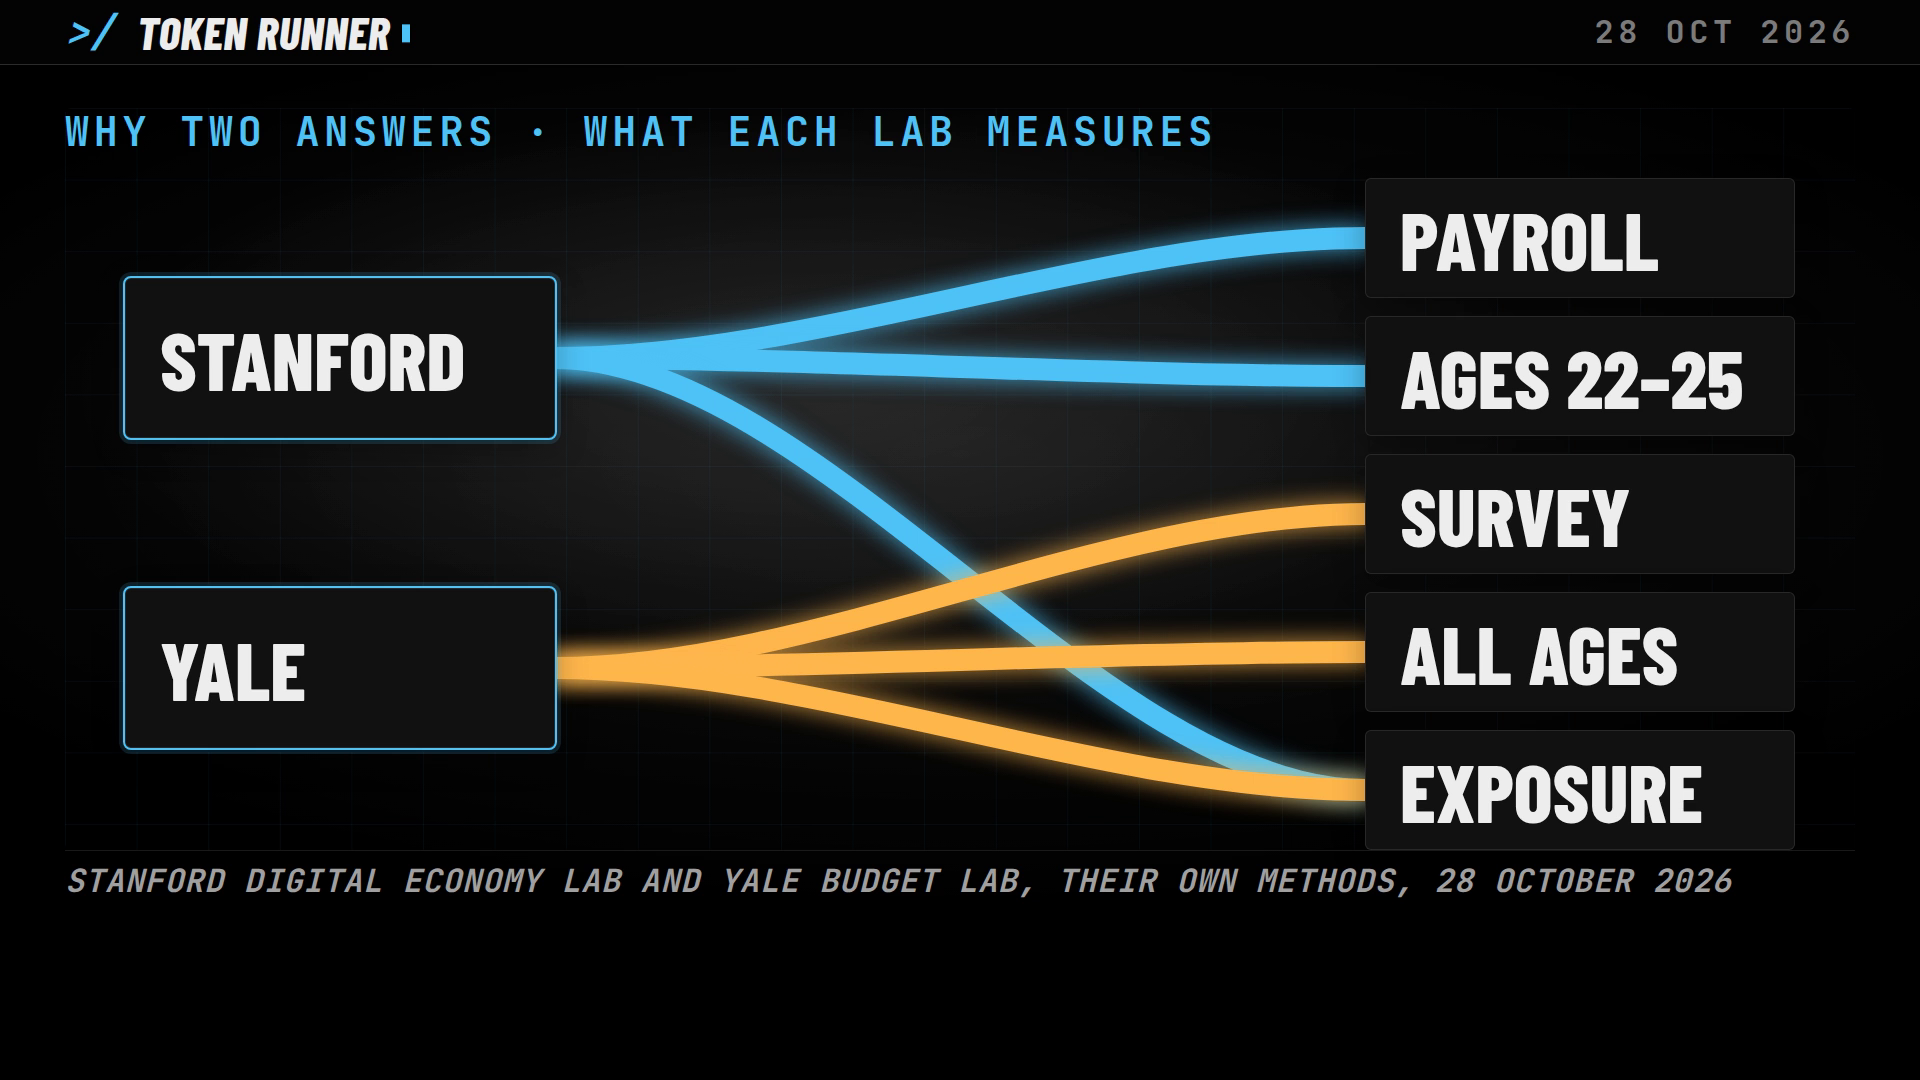
Stanford's exposure measure is Eloundou et al. (2024), in quintiles of occupations; "highly exposed" is the two most exposed quintiles (the page's footnote 1), which hold about two-thirds of the jobs in its sample. Yale's comparison takes the top third of occupations by the Budget Lab's own summary metric as exposed and the bottom third as unexposed, across all ages; its separate chart of workers by exposure level, which uses a top fifth, describes shares and is not the comparison. Stanford reports all ages 22 to 70 as well, but its headline is the 22-to-25 group.
Neither sees a collapse
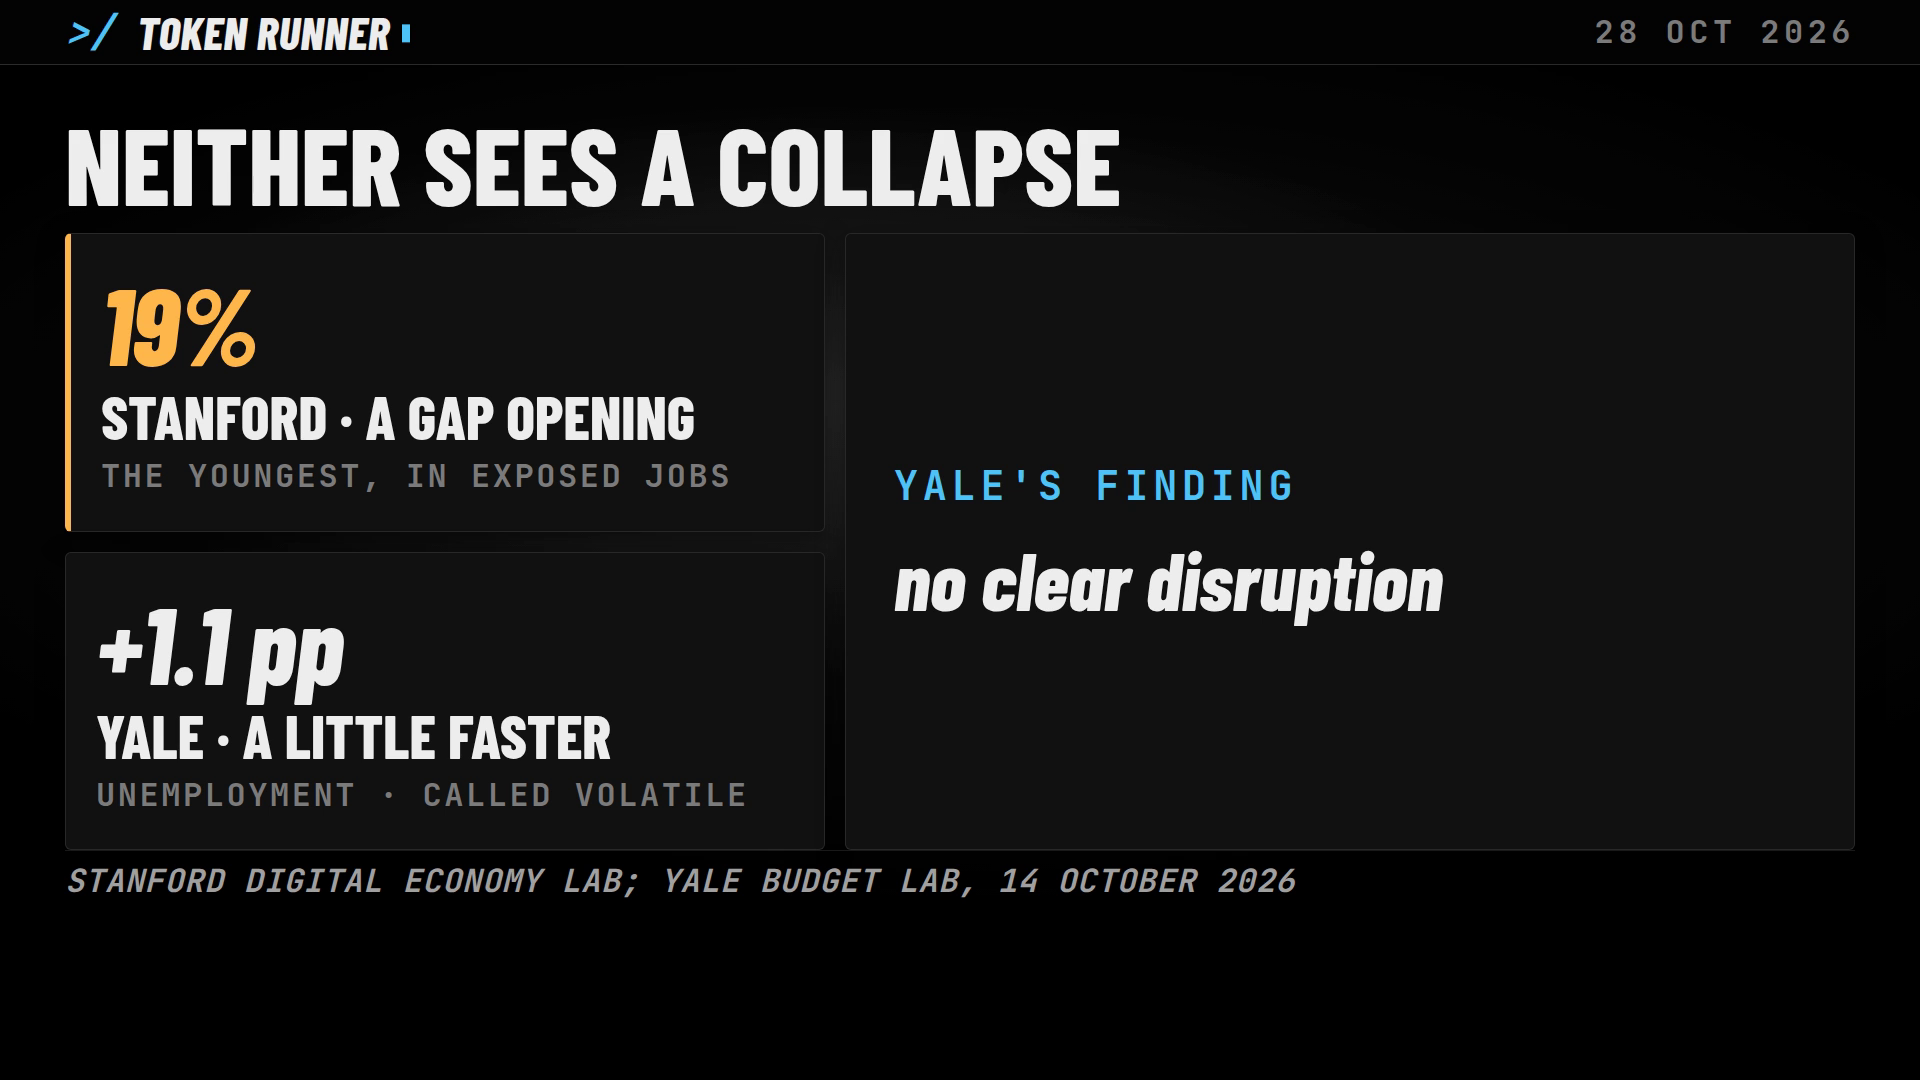
Neither lab sees a collapse. Stanford sees a gap opening for the youngest workers in exposed jobs.
Yale sees unemployment rising a little faster for exposed workers, but calls it volatile, and finds no clear disruption.
Stanford: "We do not see widespread, economy-wide job displacement associated with AI." Yale: the churn and the comparisons "are not consistent with any large-scale disruption to date." Stanford HAI's piece of 21 October reports on the same Stanford dashboards by another measure (employment for 22- to 25-year-olds in software development and customer service "has dropped over 3% annually since ChatGPT's release in November 2022, with the decline sharpening in recent months to 4.4%"); it is the same data, not a third study, and is not set against the 19%.
The first jobs
The first jobs aren't gone. In Stanford's payroll sample, fewer of them are opening where AI does the most. In Yale's survey, there's no clear sign yet.
Two things to watch. Stanford's dashboard, which updates monthly. And Yale's comparison, which updates each quarter with the household survey. Both will move.
Stanford's page: the adjustment "appears to operate primarily through reduced hiring of young workers rather than increased separations", and the gaps are larger in its ADP sample than in national survey benchmarks.
Every figure from Stanford's and Yale's own releases. Token Runner dot A I.
Sources
- Stanford Digital Economy Lab (Erik Brynjolfsson, Bharat Chandar and Ruyu Chen), "No Widespread Displacement, but the AI Employment Gap for Young Workers Has Widened to 19%", 12 August 2026, read at source and by Token Runner on 28 October 2026: "Employment among workers ages 22–25 in highly AI-exposed occupations now stands about 19% below where it would be if it had kept pace with employment among similarly aged workers in less-exposed occupations. Experienced workers show no comparable gap."; "the shortfall was 15% at the July 2025 data vintage and is 19% as of June 2026"; "These are descriptive patterns, not causal estimates of the effect of AI."; "The gaps between more- and less-exposed young workers shrink when we account for education."; "The estimated gaps are also larger in the ADP analysis sample than in national survey benchmarks."; footnote 1 on the levels. Token Runner's own table of the lab's figures.
- Stanford Digital Economy Lab, "Canaries in the Coal Mine? Six Facts About the Recent Employment Effects of Artificial Intelligence", the August 2026 revision (the paper behind the page): payroll data from ADP "covering millions of U.S. workers through June 2026"; the analysis sample is between 3.5 and 5 million employees per month.
- Stanford Digital Economy Lab, the Canaries Dashboard's composition download: the two most exposed quintiles of occupations held about two-thirds (66.2%) of the sample's employment in November 2022.
- Stanford HAI, "Tracking AI's Real-Time Footprint On The Labor Market", 21 October 2026, read at source on 28 October 2026: "Dashboards created by Stanford HAI's Digital Economy Lab", so the same Stanford data by another measure: employment for 22- to 25-year-olds in software development and customer service "has dropped over 3% annually since ChatGPT's release in November 2022, with the decline sharpening in recent months to 4.4%". Not set against the 19%.
- Yale Budget Lab, "Tracking the Impact of AI on the Labor Market", the update with September 2026 CPS data (14 October 2026), read at source on 28 October 2026 from the tracker's own text file: "does not provide clear evidence of labor market disruption associated with AI"; "the growth in unemployment of AI-exposed workers has tended to be elevated relative to growth for comparable unexposed workers since late 2022, and this is the case in the third quarter of 2026"; "These estimates are volatile and should be interpreted cautiously, particularly as they are not accompanied by other indications of labor market impacts." The tracker's data file (comparisons/unemployment-rate/data.csv on GitHub): Token Runner's own table, copied row for row.
- Yale Budget Lab (Gimbel, Kendall and Nunn), "What We Do and Don't Know About How AI is Affecting the Labor Market", 7 May 2026: the comparison's exposed group is the top third of occupations by the lab's summary metric, the unexposed group the bottom third; the headline analysis is not age-restricted.
- U.S. Bureau of Labor Statistics, the Current Population Survey: the government's monthly survey of households, the data behind Yale's comparison (BLS via IPUMS-CPS) (bls.gov answers 403 to a script; the same series is readable in the tracker's data.csv on GitHub, linked below).
- The Budget Lab's tracker data, data.csv on GitHub (the unemployment-rate comparison the tracker draws; the same series bls.gov serves).