SOCIETY
Work, culture, robots, fakes, and how people live with AI
14 cards on 24 tables, each drawn live from the table. Tables built 1 November 2026.
What people think of AI
Opinions on products and services using AI, 2022 to 2025
Data: Ipsos, 2022 to 2025, as published in Stanford HAI, AI Index Report 2026, figure 9.1.1. Values as published. Licensed CC BY-ND 4.0. The table and its date
Source and method
Whose figures: The numbers are Ipsos, 2022 to 2025; published by Stanford HAI in the AI Index Report 2026, figure 9.1.1. CC BY-ND 4.0, values copied exactly
Unit: share of respondents, 0 to 1
The rows
Read from the same data file as the chart when this is opened.
Opinions about AI by country, 2025
Data: Ipsos, 2025, as published in Stanford HAI, AI Index Report 2026, figure 9.1.3. Values as published. Licensed CC BY-ND 4.0. The table and its date
Source and method
Whose figures: The numbers are Ipsos, 2025; published by Stanford HAI in the AI Index Report 2026, figure 9.1.3. CC BY-ND 4.0, values copied exactly
Unit: share of respondents, 0 to 1
The rows
Read from the same data file as the chart when this is opened.
How those opinions moved, 2024 to 2025
Data: Ipsos, 2024 to 2025, as published in Stanford HAI, AI Index Report 2026, figure 9.1.4. Values as published. Licensed CC BY-ND 4.0. The table and its date
Source and method
Whose figures: The numbers are Ipsos, 2024 to 2025; published by Stanford HAI in the AI Index Report 2026, figure 9.1.4. CC BY-ND 4.0, values copied exactly
Unit: change in the share, in points of the 0 to 1 scale
The rows
Read from the same data file as the chart when this is opened.
The public and the experts
AI's effect on areas of society: US adults and AI experts
Data: Pew Research, 2025, as published in Stanford HAI, AI Index Report 2026, figure 9.2.1. Values as published. Licensed CC BY-ND 4.0. The table and its date
Source and method
Whose figures: The numbers are Pew Research, 2025; published by Stanford HAI in the AI Index Report 2026, figure 9.2.1. CC BY-ND 4.0, values copied exactly
Unit: per cent of respondents
The rows
Read from the same data file as the chart when this is opened.
Will AI lead to more or fewer jobs
Data: Pew Research, 2025, as published in Stanford HAI, AI Index Report 2026, figure 9.2.4. Values as published. Licensed CC BY-ND 4.0. The table and its date
Source and method
Whose figures: The numbers are Pew Research, 2025; published by Stanford HAI in the AI Index Report 2026, figure 9.2.4. CC BY-ND 4.0, values copied exactly
Unit: per cent of respondents
The rows
Read from the same data file as the chart when this is opened.
Forecast: US adults using an AI companion daily
Data: Forecasting Research Institute, 2026, as published in Stanford HAI, AI Index Report 2026, figure 9.2.9. Values as published. Licensed CC BY-ND 4.0. The table and its date
Source and method
Whose figures: The numbers are Forecasting Research Institute, 2026; published by Stanford HAI in the AI Index Report 2026, figure 9.2.9. CC BY-ND 4.0, values copied exactly
Unit: per cent of US adults
A fiscal year is named for the year it ends in, so for some companies fiscal 2040 has already begun. Years still open are marked "so far".
The rows
Read from the same data file as the chart when this is opened.
Trust in AI and use of it at work, by country, 2025
Data: University of Melbourne and KPMG International, 2025, as published in Stanford HAI, AI Index Report 2026, figure 9.1.10. Values as published. Licensed CC BY-ND 4.0. The table and its date
Source and method
Whose figures: The numbers are University of Melbourne and KPMG International, 2025; published by Stanford HAI in the AI Index Report 2026, figure 9.1.10. CC BY-ND 4.0, values copied exactly
Unit: per cent of respondents
The rows
Read from the same data file as the chart when this is opened.
Who is trusted to set the rules
Trust in the EU, the US, China and one's own country to regulate AI, 2025
Data: Pew Research, 2025, as published in Stanford HAI, AI Index Report 2026, figure 9.3.2. Values as published. Licensed CC BY-ND 4.0. The table and its date
Source and method
Whose figures: The numbers are Pew Research, 2025; published by Stanford HAI in the AI Index Report 2026, figure 9.3.2. CC BY-ND 4.0, values copied exactly
Unit: share of respondents, 0 to 1
The rows
Read from the same data file as the chart when this is opened.
Trust in one's government to regulate AI, by country, 2025
Data: Ipsos, 2025, as published in Stanford HAI, AI Index Report 2026, figure 9.3.1. Values as published. Licensed CC BY-ND 4.0. The table and its date
Source and method
Whose figures: The numbers are Ipsos, 2025; published by Stanford HAI in the AI Index Report 2026, figure 9.3.1. CC BY-ND 4.0, values copied exactly
Unit: share of respondents, 0 to 1
The rows
Read from the same data file as the chart when this is opened.
Federal regulation of AI: views by US state, 2025
Data: CHIP50, 2025, as published in Stanford HAI, AI Index Report 2026, figure 9.3.5. Values as published. Licensed CC BY-ND 4.0. The table and its date
Source and method
Whose figures: The numbers are CHIP50, 2025; published by Stanford HAI in the AI Index Report 2026, figure 9.3.5. CC BY-ND 4.0, values copied exactly
Unit: share of respondents, 0 to 1
The rows
Read from the same data file as the chart when this is opened.
The layoffs: what the companies said and what the rooms said
AI's role in the companies' own framing, coloured by who said AI
Source: Layoffs.fyi's AI-attributed list and its whole list by month, theirs; company names from SEC EDGAR; a hand read of the companies' own words on 28 October 2026; the research join of 28 October 2026; the relabel of 29 October 2026.
Source and method
Source: Layoffs.fyi's AI-attributed list and its whole list by month, theirs; company names from SEC EDGAR; a hand read of the companies' own words on 28 October 2026; the research join of 28 October 2026 (filings, company pages, WARN notices and press, every value cited); the relabel of 29 October 2026 (filings, company posts and state WARN sheets opened by hand). Adapted by Token Runner: filtered and added up for this chart. The table, its licence and its date
Whose figures: Layoffs.fyi (the lister; its numbers and its attribution); company names from SEC EDGAR; the hand read of 28 October 2026; the research join of 28 October 2026; the relabel of 29 October 2026
Unit: jobs
This table and its charts: Token Runner's own, under CC BY 4.0; the source keeps its own terms. Cite this: Token Runner, "The event record: AI-attributed layoffs, one row per cut", tokenrunner.ai/esper/society/#data-gold_layoffs_events, built 2026-10-31. CC BY 4.0.
The rows
Read from the same data file as the chart when this is opened.
The voices: what the rooms talk about, by theme, company and layer
Source: The research pass of 28 October 2026 on Blind, Glassdoor, Reddit and the named outlets; the TheLayoff board study of 28 October 2026; X posts gathered by the house collector; the theme and stance codes are ours.
Source and method
Source: The research pass of 28 October 2026 on Blind, Glassdoor, Reddit and the named outlets; the TheLayoff board study of 28 October 2026 (73 boards read directly); X posts gathered by the house collector; the theme and stance codes are ours. Adapted by Token Runner: filtered and added up for this chart. The table, its licence and its date
How it is sourced: Blind, Glassdoor, Reddit and TheLayoff as read on 28 October 2026 by the research pass and the board study (counts are the platforms' own; TheLayoff thread counts are floors where capped); the anonymous accounts as the named outlets printed them; theme and stance codes are ours
Unit: posts
This table and its charts: Token Runner's own, under CC BY 4.0; the source keeps its own terms. Cite this: Token Runner, "The voice record: what the people say about the cuts, as codes and counts", tokenrunner.ai/esper/society/#data-gold_layoffs_voices, built 2026-10-31. CC BY 4.0.
The rows
Read from the same data file as the chart when this is opened.
Blind's most-discussed posts: layoff posts tied to AI and not, by month
Source: The research pass of 28 October 2026 on Blind, Glassdoor, Reddit and the named outlets; the TheLayoff board study of 28 October 2026; X posts gathered by the house collector; the theme and stance codes are ours.
Source and method
Source: The research pass of 28 October 2026 on Blind, Glassdoor, Reddit and the named outlets; the TheLayoff board study of 28 October 2026 (73 boards read directly); X posts gathered by the house collector; the theme and stance codes are ours. Adapted by Token Runner: filtered and added up for this chart. The table, its licence and its date
How it is sourced: Blind, Glassdoor, Reddit and TheLayoff as read on 28 October 2026 by the research pass and the board study (counts are the platforms' own; TheLayoff thread counts are floors where capped); the anonymous accounts as the named outlets printed them; theme and stance codes are ours
Unit: posts
This table and its charts: Token Runner's own, under CC BY 4.0; the source keeps its own terms. Cite this: Token Runner, "The voice record: what the people say about the cuts, as codes and counts", tokenrunner.ai/esper/society/#data-gold_layoffs_voices, built 2026-10-31. CC BY 4.0.
The rows
Read from the same data file as the chart when this is opened.
The layoffs dossier: every chart of the dossier, one button a view
Source: U.S. Bureau of Labor Statistics, Job Openings and Labor Turnover Survey, through the BLS public API v1; raw answer raw/bls-jolts/2026-10-29T122018.json, sha256 2e44b8ebf403651459f1e5fdd6272f202a47e89afa7023ed96b61e314b660cfe.
Source and method
Source: U.S. Bureau of Labor Statistics, Job Openings and Labor Turnover Survey, through the BLS public API v1 (no key); raw answer raw/bls-jolts/2026-10-29T122018.json, sha256 2e44b8ebf403651459f1e5fdd6272f202a47e89afa7023ed96b61e314b660cfe. Adapted by Token Runner: filtered and added up for this chart. The table, its licence and its date
How it is sourced: BLS JOLTS (US government public record), fetched through the public API; levels as published
Unit: thousands
This table and its charts: Token Runner's own, under CC BY 4.0; the source keeps its own terms. Cite this: Token Runner, "BLS JOLTS: openings, hires and layoffs, total nonfarm and the Information sector, by month", tokenrunner.ai/esper/society/#data-gold_bls_jolts, built 2026-10-29. CC BY 4.0.
The rows
Read from the same data file as the chart when this is opened.
Source: U.S. Bureau of Labor Statistics, Job Openings and Labor Turnover Survey, through the BLS public API v1; raw answer raw/bls-jolts/2026-10-29T122018.json, sha256 2e44b8ebf403651459f1e5fdd6272f202a47e89afa7023ed96b61e314b660cfe.
Source and method
Source: U.S. Bureau of Labor Statistics, Job Openings and Labor Turnover Survey, through the BLS public API v1 (no key); raw answer raw/bls-jolts/2026-10-29T122018.json, sha256 2e44b8ebf403651459f1e5fdd6272f202a47e89afa7023ed96b61e314b660cfe. Adapted by Token Runner: filtered and added up for this chart. The table, its licence and its date
How it is sourced: BLS JOLTS (US government public record), fetched through the public API; levels as published
Unit: thousands
This table and its charts: Token Runner's own, under CC BY 4.0; the source keeps its own terms. Cite this: Token Runner, "BLS JOLTS: openings, hires and layoffs, total nonfarm and the Information sector, by month", tokenrunner.ai/esper/society/#data-gold_bls_jolts, built 2026-10-29. CC BY 4.0.
The rows
Read from the same data file as the chart when this is opened.
Source and method
Source: Layoffs.fyi, the AI layoffs list and its monthly totals (https://layoffs.fyi/ai-layoffs/). Adapted by Token Runner: filtered and added up for this chart. The table, its licence and its date
Whose figures: According to Layoffs.fyi (https://layoffs.fyi/), which tracks tech industry layoffs.
Unit: employees
This table and its charts: Token Runner's own, under CC BY 4.0; the source keeps its own terms. Cite this: Token Runner, "All layoffs against AI-attributed layoffs, by month", tokenrunner.ai/esper/society/#data-gold_layoffs_all_monthly, built 2026-10-31. CC BY 4.0.
The rows
Read from the same data file as the chart when this is opened.
Source and method
Source: Layoffs.fyi, the AI layoffs list and its monthly totals (https://layoffs.fyi/ai-layoffs/). Adapted by Token Runner: filtered and added up for this chart. The table, its licence and its date
Whose figures: According to Layoffs.fyi (https://layoffs.fyi/), which tracks tech industry layoffs.
Unit: employees
This table and its charts: Token Runner's own, under CC BY 4.0; the source keeps its own terms. Cite this: Token Runner, "All layoffs against AI-attributed layoffs, by month", tokenrunner.ai/esper/society/#data-gold_layoffs_all_monthly, built 2026-10-31. CC BY 4.0.
The rows
Read from the same data file as the chart when this is opened.
Source and method
Source: Layoffs.fyi, the AI layoffs list and its monthly totals (https://layoffs.fyi/ai-layoffs/). Adapted by Token Runner: filtered and added up for this chart. The table, its licence and its date
Whose figures: According to Layoffs.fyi (https://layoffs.fyi/), which tracks tech industry layoffs.
Unit: employees
This table and its charts: Token Runner's own, under CC BY 4.0; the source keeps its own terms. Cite this: Token Runner, "All layoffs against AI-attributed layoffs, by month", tokenrunner.ai/esper/society/#data-gold_layoffs_all_monthly, built 2026-10-31. CC BY 4.0.
The rows
Read from the same data file as the chart when this is opened.
Source and method
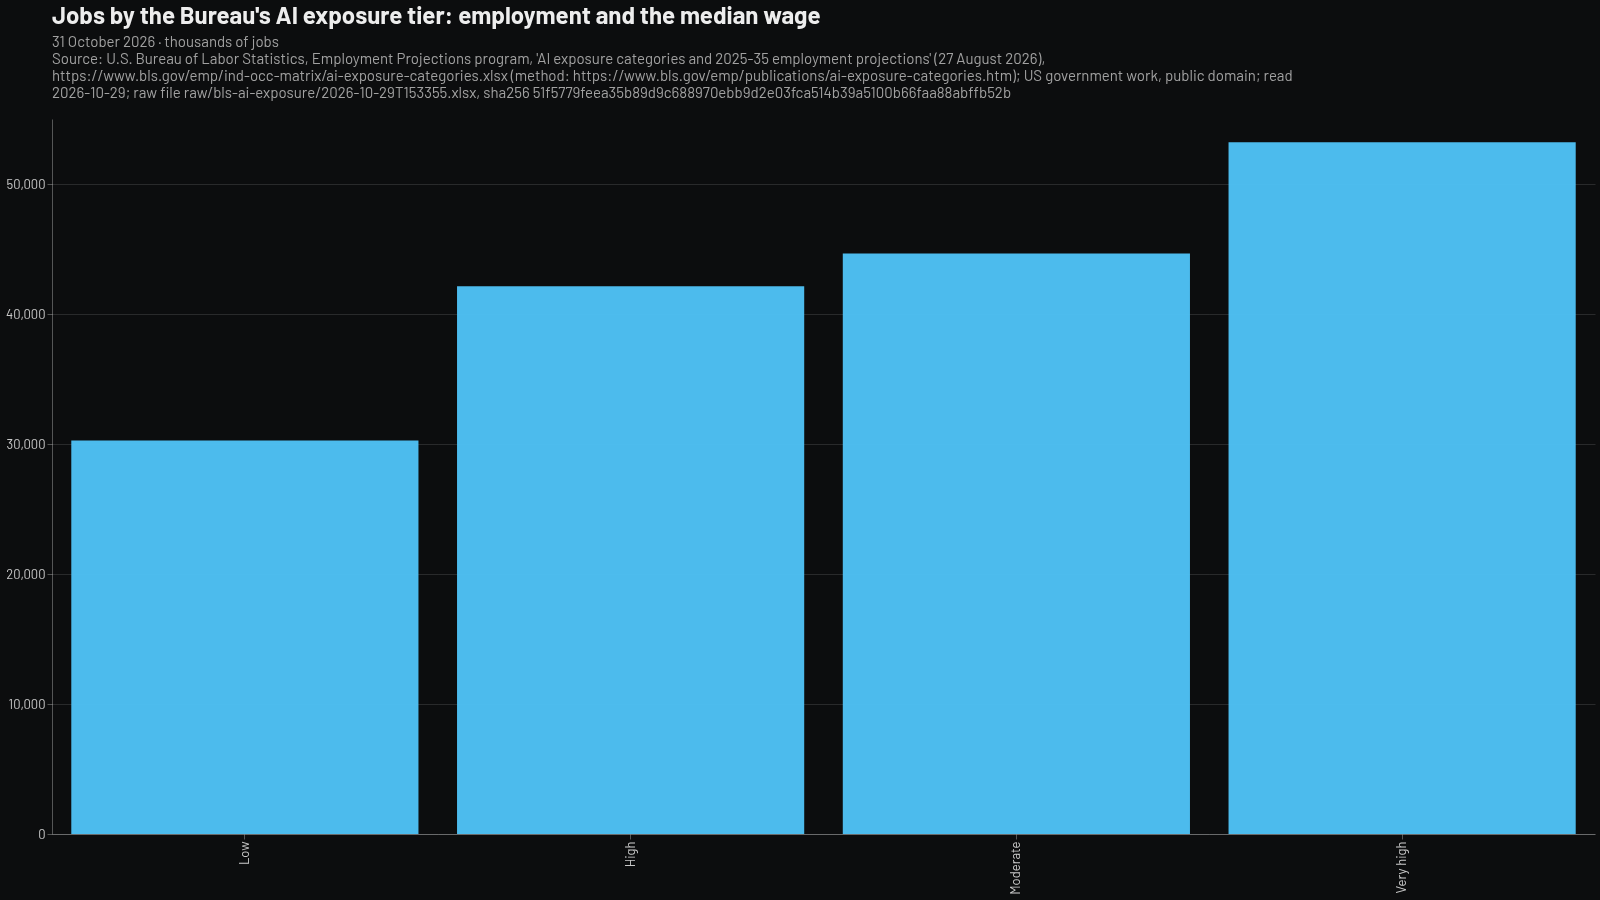
Source: U.S. Bureau of Labor Statistics, Employment Projections program, 'AI exposure categories and 2025-35 employment projections' (27 August 2026), https://www.bls.gov/emp/ind-occ-matrix/ai-exposure-categories.xlsx (method: https://www.bls.gov/emp/publications/ai-exposure-categories.htm); US government work, public domain; read 2026-10-29; raw file raw/bls-ai-exposure/2026-10-29T153355.xlsx, sha256 51f5779feea35b89d9c688970ebb9d2e03fca514b39a5100b66faa88abffb52b. Adapted by Token Runner: filtered and added up for this chart. The table, its licence and its date
How it is sourced: BLS Employment Projections, AI exposure categories (US government public record, public domain); figures as published
Unit: employment in thousands of jobs; wage in US dollars
This table and its charts: Token Runner's own, under CC BY 4.0; the source keeps its own terms. Cite this: Token Runner, "BLS: relative AI exposure of 831 occupations, with employment, projections and median wage", tokenrunner.ai/esper/society/#data-gold_bls_ai_exposure, built 2026-10-29. CC BY 4.0.
The rows
Read from the same data file as the chart when this is opened.
Source and method
Source: U.S. Bureau of Labor Statistics, Employment Projections program, 'AI exposure categories and 2025-35 employment projections' (27 August 2026), https://www.bls.gov/emp/ind-occ-matrix/ai-exposure-categories.xlsx (method: https://www.bls.gov/emp/publications/ai-exposure-categories.htm); US government work, public domain; read 2026-10-29; raw file raw/bls-ai-exposure/2026-10-29T153355.xlsx, sha256 51f5779feea35b89d9c688970ebb9d2e03fca514b39a5100b66faa88abffb52b. Adapted by Token Runner: filtered and added up for this chart. The table, its licence and its date
How it is sourced: BLS Employment Projections, AI exposure categories (US government public record, public domain); figures as published
Unit: employment in thousands of jobs; wage in US dollars
This table and its charts: Token Runner's own, under CC BY 4.0; the source keeps its own terms. Cite this: Token Runner, "BLS: relative AI exposure of 831 occupations, with employment, projections and median wage", tokenrunner.ai/esper/society/#data-gold_bls_ai_exposure, built 2026-10-29. CC BY 4.0.
The rows
Read from the same data file as the chart when this is opened.
Source and method
Source: U.S. Bureau of Labor Statistics, Employment Projections program, 'AI exposure categories and 2025-35 employment projections' (27 August 2026), https://www.bls.gov/emp/ind-occ-matrix/ai-exposure-categories.xlsx (method: https://www.bls.gov/emp/publications/ai-exposure-categories.htm); US government work, public domain; read 2026-10-29; raw file raw/bls-ai-exposure/2026-10-29T153355.xlsx, sha256 51f5779feea35b89d9c688970ebb9d2e03fca514b39a5100b66faa88abffb52b. Adapted by Token Runner: filtered and added up for this chart. The table, its licence and its date
How it is sourced: BLS Employment Projections, AI exposure categories (US government public record, public domain); figures as published
Unit: employment in thousands of jobs; wage in US dollars
This table and its charts: Token Runner's own, under CC BY 4.0; the source keeps its own terms. Cite this: Token Runner, "BLS: relative AI exposure of 831 occupations, with employment, projections and median wage", tokenrunner.ai/esper/society/#data-gold_bls_ai_exposure, built 2026-10-29. CC BY 4.0.
The rows
Read from the same data file as the chart when this is opened.
Source and method
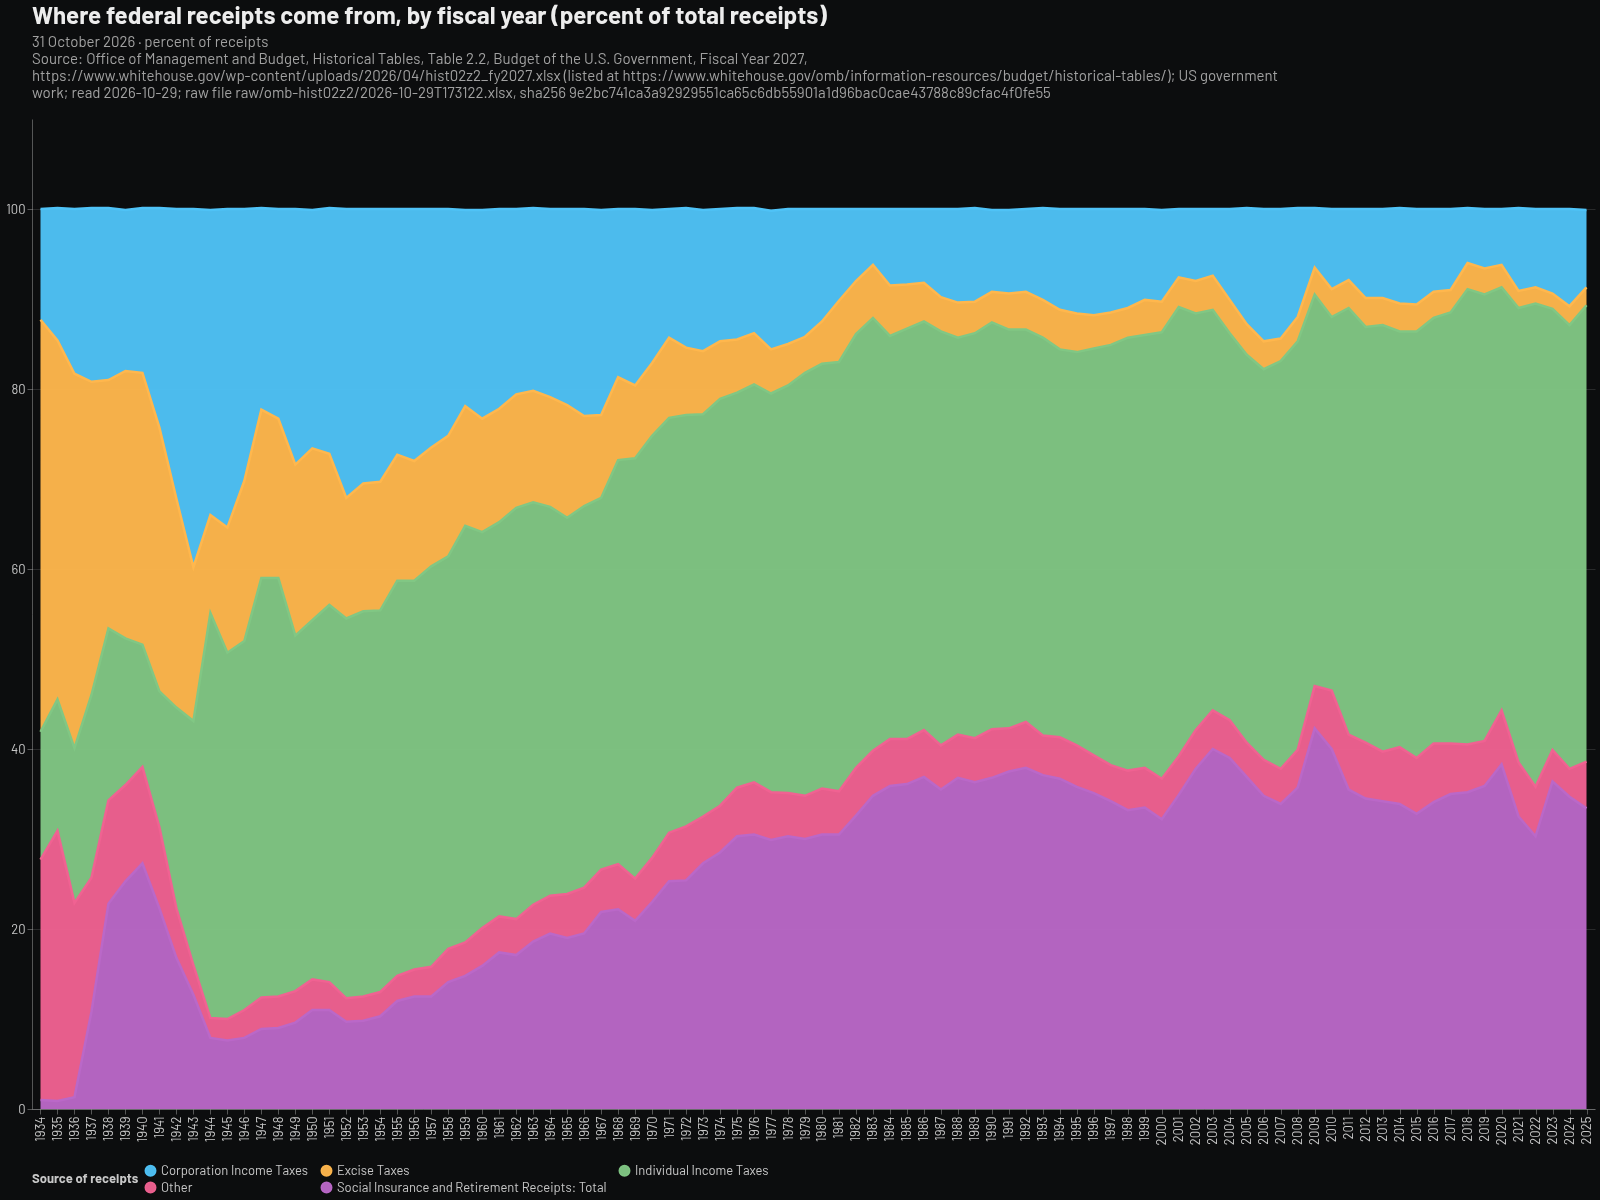
Source: Office of Management and Budget, Historical Tables, Table 2.2, Budget of the U.S. Government, Fiscal Year 2027, https://www.whitehouse.gov/wp-content/uploads/2026/04/hist02z2_fy2027.xlsx (listed at https://www.whitehouse.gov/omb/information-resources/budget/historical-tables/); US government work; read 2026-10-29; raw file raw/omb-hist02z2/2026-10-29T173122.xlsx, sha256 9e2bc741ca3a92929551ca65c6db55901a1d96bac0cae43788c89cfac4f0fe55. Adapted by Token Runner: filtered and added up for this chart. The table, its licence and its date
How it is sourced: OMB Historical Tables (US government public record); percents as published
Unit: percent of total federal receipts
This table and its charts: Token Runner's own, under CC BY 4.0; the source keeps its own terms. Cite this: Token Runner, "OMB Historical Table 2.2: the percentage composition of federal receipts by source, 1934 to 2031", tokenrunner.ai/esper/society/#data-gold_omb_receipts_by_source, built 2026-10-29. CC BY 4.0.
The rows
Read from the same data file as the chart when this is opened.
Source and method
Source: U.S. Bureau of Labor Statistics (Productivity and Costs) and U.S. Bureau of Economic Analysis (Gross Domestic Product), via FRED, Federal Reserve Bank of St. Louis: https://fred.stlouisfed.org/series/PRS85006173; https://fred.stlouisfed.org/series/A4002E1A156NBEA; US government works; read 2026-10-29; raw raw/fred-labour-share/2026-10-29T154354/PRS85006173.csv sha256 f3b9ce09c3d14893e94e7eeaffd4074f6598df7dcd893ba52335198bf65fd3ce; raw/fred-labour-share/2026-10-29T154354/A4002E1A156NBEA.csv sha256 9069523b6fdbdcc83c477df09ba90850013d38d5fa3a540f30ac2b7abd58b9dc. Adapted by Token Runner: filtered and added up for this chart. The table, its licence and its date
How it is sourced: BLS and BEA series via FRED (US government public record); values as published
Unit: index 2017=100 (PRS85006173); percent (A4002E1A156NBEA)
This table and its charts: Token Runner's own, under CC BY 4.0; the source keeps its own terms. Cite this: Token Runner, "Labour's share of income: the BLS labor share index and the BEA compensation share of GDI", tokenrunner.ai/esper/society/#data-gold_fred_labour_share, built 2026-10-29. CC BY 4.0.
The rows
Read from the same data file as the chart when this is opened.
Source and method
Source: U.S. Bureau of Labor Statistics (Productivity and Costs) and U.S. Bureau of Economic Analysis (Gross Domestic Product), via FRED, Federal Reserve Bank of St. Louis: https://fred.stlouisfed.org/series/PRS85006173; https://fred.stlouisfed.org/series/A4002E1A156NBEA; US government works; read 2026-10-29; raw raw/fred-labour-share/2026-10-29T154354/PRS85006173.csv sha256 f3b9ce09c3d14893e94e7eeaffd4074f6598df7dcd893ba52335198bf65fd3ce; raw/fred-labour-share/2026-10-29T154354/A4002E1A156NBEA.csv sha256 9069523b6fdbdcc83c477df09ba90850013d38d5fa3a540f30ac2b7abd58b9dc. Adapted by Token Runner: filtered and added up for this chart. The table, its licence and its date
How it is sourced: BLS and BEA series via FRED (US government public record); values as published
Unit: index 2017=100 (PRS85006173); percent (A4002E1A156NBEA)
This table and its charts: Token Runner's own, under CC BY 4.0; the source keeps its own terms. Cite this: Token Runner, "Labour's share of income: the BLS labor share index and the BEA compensation share of GDI", tokenrunner.ai/esper/society/#data-gold_fred_labour_share, built 2026-10-29. CC BY 4.0.
The rows
Read from the same data file as the chart when this is opened.
Source and method
Source: California EDD WARN report (Detailed WARN Report tab, https://edd.ca.gov/siteassets/files/jobs_and_training/warn/warn_report1.xlsx; sha256 df7a4d8fd0b170cb1ced6e08416efac00f266f1f58cf1bb0d641a9a1664c4db7); Washington ESD; New York DOL; NC Commerce; Illinois worknet (state public records), the four as read on 29 October 2026. Adapted by Token Runner: filtered and added up for this chart. The table, its licence and its date
How it is sourced: State WARN lists (public record of what employers filed); a notice says nothing about cause
Unit: workers
This table and its charts: Token Runner's own, under CC BY 4.0; the source keeps its own terms. Cite this: Token Runner, "The WARN windows: the state lists opened, their windows and counts, and California notice by notice", tokenrunner.ai/esper/society/#data-gold_warn_windows, built 2026-10-29. CC BY 4.0.
The rows
Read from the same data file as the chart when this is opened.
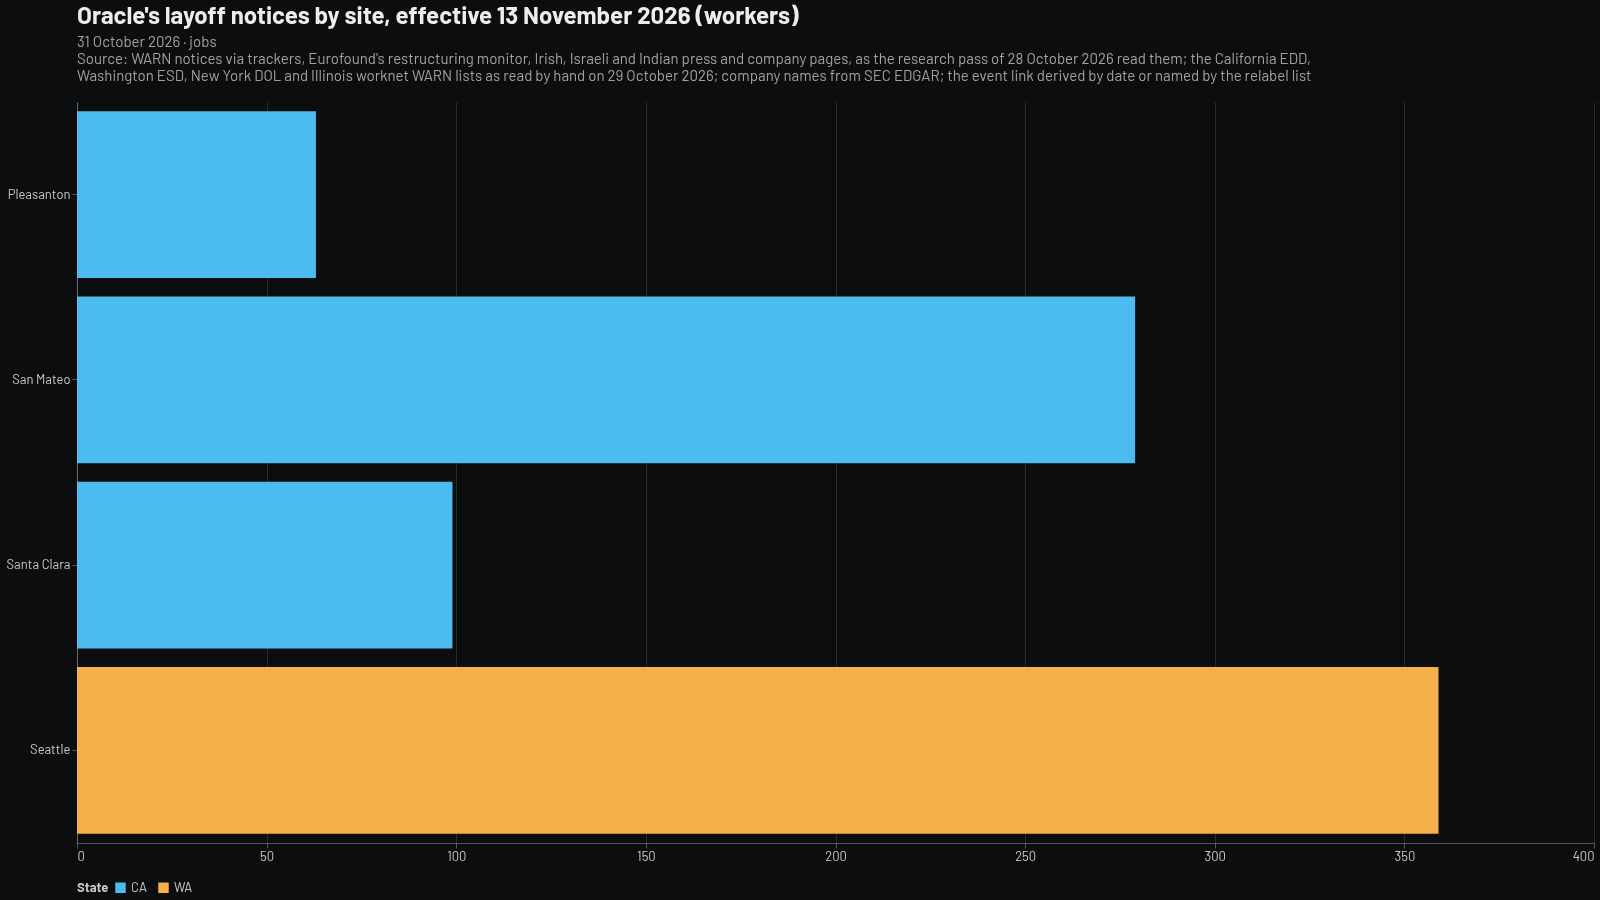
Source: WARN notices via trackers, Eurofound's restructuring monitor, Irish, Israeli and Indian press and company pages, as the research pass of 28 October 2026 read them; the California EDD, Washington ESD, New York DOL and Illinois worknet WARN lists as read by hand on 29 October 2026; company names from SEC EDGAR; the event link derived by date or named by the relabel list.
Source and method
Source: WARN notices via trackers, Eurofound's restructuring monitor, Irish, Israeli and Indian press and company pages, as the research pass of 28 October 2026 read them; the California EDD, Washington ESD, New York DOL and Illinois worknet WARN lists as read by hand on 29 October 2026; company names from SEC EDGAR; the event link derived by date or named by the relabel list. Adapted by Token Runner: filtered and added up for this chart. The table, its licence and its date
How it is sourced: WARN notices, the EU restructuring monitor and named outlets as the research pass read them on 28 October 2026; the states' own WARN lists as read on 29 October 2026 (FACT rows); the event link is derived by date or named, and says which
Unit: jobs
This table and its charts: Token Runner's own, under CC BY 4.0; the source keeps its own terms. Cite this: Token Runner, "The sites record: where the cuts landed, country and site, as the research pass found them", tokenrunner.ai/esper/society/#data-gold_layoffs_sites, built 2026-10-31. CC BY 4.0.
The rows
Read from the same data file as the chart when this is opened.
Source: WARN notices via trackers, Eurofound's restructuring monitor, Irish, Israeli and Indian press and company pages, as the research pass of 28 October 2026 read them; the California EDD, Washington ESD, New York DOL and Illinois worknet WARN lists as read by hand on 29 October 2026; company names from SEC EDGAR; the event link derived by date or named by the relabel list.
Source and method
Source: WARN notices via trackers, Eurofound's restructuring monitor, Irish, Israeli and Indian press and company pages, as the research pass of 28 October 2026 read them; the California EDD, Washington ESD, New York DOL and Illinois worknet WARN lists as read by hand on 29 October 2026; company names from SEC EDGAR; the event link derived by date or named by the relabel list. Adapted by Token Runner: filtered and added up for this chart. The table, its licence and its date
How it is sourced: WARN notices, the EU restructuring monitor and named outlets as the research pass read them on 28 October 2026; the states' own WARN lists as read on 29 October 2026 (FACT rows); the event link is derived by date or named, and says which
Unit: jobs
This table and its charts: Token Runner's own, under CC BY 4.0; the source keeps its own terms. Cite this: Token Runner, "The sites record: where the cuts landed, country and site, as the research pass found them", tokenrunner.ai/esper/society/#data-gold_layoffs_sites, built 2026-10-31. CC BY 4.0.
The rows
Read from the same data file as the chart when this is opened.
Source: WARN notices via trackers, Eurofound's restructuring monitor, Irish, Israeli and Indian press and company pages, as the research pass of 28 October 2026 read them; the California EDD, Washington ESD, New York DOL and Illinois worknet WARN lists as read by hand on 29 October 2026; company names from SEC EDGAR; the event link derived by date or named by the relabel list.
Source and method
Source: WARN notices via trackers, Eurofound's restructuring monitor, Irish, Israeli and Indian press and company pages, as the research pass of 28 October 2026 read them; the California EDD, Washington ESD, New York DOL and Illinois worknet WARN lists as read by hand on 29 October 2026; company names from SEC EDGAR; the event link derived by date or named by the relabel list. Adapted by Token Runner: filtered and added up for this chart. The table, its licence and its date
How it is sourced: WARN notices, the EU restructuring monitor and named outlets as the research pass read them on 28 October 2026; the states' own WARN lists as read on 29 October 2026 (FACT rows); the event link is derived by date or named, and says which
Unit: jobs
This table and its charts: Token Runner's own, under CC BY 4.0; the source keeps its own terms. Cite this: Token Runner, "The sites record: where the cuts landed, country and site, as the research pass found them", tokenrunner.ai/esper/society/#data-gold_layoffs_sites, built 2026-10-31. CC BY 4.0.
The rows
Read from the same data file as the chart when this is opened.
Source: WARN notices via trackers, Eurofound's restructuring monitor, Irish, Israeli and Indian press and company pages, as the research pass of 28 October 2026 read them; the California EDD, Washington ESD, New York DOL and Illinois worknet WARN lists as read by hand on 29 October 2026; company names from SEC EDGAR; the event link derived by date or named by the relabel list.
Source and method
Source: WARN notices via trackers, Eurofound's restructuring monitor, Irish, Israeli and Indian press and company pages, as the research pass of 28 October 2026 read them; the California EDD, Washington ESD, New York DOL and Illinois worknet WARN lists as read by hand on 29 October 2026; company names from SEC EDGAR; the event link derived by date or named by the relabel list. Adapted by Token Runner: filtered and added up for this chart. The table, its licence and its date
How it is sourced: WARN notices, the EU restructuring monitor and named outlets as the research pass read them on 28 October 2026; the states' own WARN lists as read on 29 October 2026 (FACT rows); the event link is derived by date or named, and says which
Unit: jobs
This table and its charts: Token Runner's own, under CC BY 4.0; the source keeps its own terms. Cite this: Token Runner, "The sites record: where the cuts landed, country and site, as the research pass found them", tokenrunner.ai/esper/society/#data-gold_layoffs_sites, built 2026-10-31. CC BY 4.0.
The rows
Read from the same data file as the chart when this is opened.
Source: Token Runner's reading of each company's filings, exhibits, posts and reported remarks; each row names its own source.
Source and method
Source: Token Runner's reading of each company's filings, exhibits, posts and reported remarks; each row names its own source. Adapted by Token Runner: filtered and added up for this chart. The table, its licence and its date
How it is sourced: the companies' words as opened (FACT) or as the press reports them (REPORTED)
Unit: companies
This table and its charts: Token Runner's own, under CC BY 4.0; the source keeps its own terms. Cite this: Token Runner, "Where the companies say it: the place each company's AI words appear", tokenrunner.ai/esper/society/#data-gold_where_companies_say_it, built 2026-10-31. CC BY 4.0.
The rows
Read from the same data file as the chart when this is opened.
Source: Token Runner's reading of each company's filings, exhibits, posts and reported remarks; each row names its own source.
Source and method
Source: Token Runner's reading of each company's filings, exhibits, posts and reported remarks; each row names its own source. Adapted by Token Runner: filtered and added up for this chart. The table, its licence and its date
How it is sourced: the companies' words as opened (FACT) or as the press reports them (REPORTED)
Unit: companies
This table and its charts: Token Runner's own, under CC BY 4.0; the source keeps its own terms. Cite this: Token Runner, "Where the companies say it: the place each company's AI words appear", tokenrunner.ai/esper/society/#data-gold_where_companies_say_it, built 2026-10-31. CC BY 4.0.
The rows
Read from the same data file as the chart when this is opened.
Source: Token Runner's reading of each company's filings, exhibits, posts and reported remarks; each row names its own source.
Source and method
Source: Token Runner's reading of each company's filings, exhibits, posts and reported remarks; each row names its own source. Adapted by Token Runner: filtered and added up for this chart. The table, its licence and its date
How it is sourced: the companies' words as opened (FACT) or as the press reports them (REPORTED)
Unit: companies
This table and its charts: Token Runner's own, under CC BY 4.0; the source keeps its own terms. Cite this: Token Runner, "Where the companies say it: the place each company's AI words appear", tokenrunner.ai/esper/society/#data-gold_where_companies_say_it, built 2026-10-31. CC BY 4.0.
The rows
Read from the same data file as the chart when this is opened.
Source: Layoffs.fyi's AI-attributed list, as listed, with the research join of 28 October 2026 and the relabel of 29 October 2026; SEC XBRL companyfacts, each company's 10-Q and 10-K.
Source and method
Source: Layoffs.fyi's AI-attributed list, as listed (jobs gone, REPORTED), with the research join of 28 October 2026 and the relabel of 29 October 2026 (the jobs figure tested against the company's own filing or post); SEC XBRL companyfacts, each company's 10-Q and 10-K (capital spending, FACT). Adapted by Token Runner: filtered and added up for this chart. The table, its licence and its date
How it is sourced: Derived from the event record and the filers' quarterly capital table by a stated rule; the jobs figures are Layoffs.fyi's, the capital figures the filings' own
Unit: jobs; USD billions
This table and its charts: Token Runner's own, under CC BY 4.0; the source keeps its own terms. Cite this: Token Runner, "The spine: jobs gone against capital spent, by company-year", tokenrunner.ai/esper/society/#data-gold_layoffs_spine, built 2026-10-31. CC BY 4.0.
The rows
Read from the same data file as the chart when this is opened.
Source: Layoffs.fyi's AI-attributed list, as listed, with the research join of 28 October 2026 and the relabel of 29 October 2026; SEC XBRL companyfacts, each company's 10-Q and 10-K.
Source and method
Source: Layoffs.fyi's AI-attributed list, as listed (jobs gone, REPORTED), with the research join of 28 October 2026 and the relabel of 29 October 2026 (the jobs figure tested against the company's own filing or post); SEC XBRL companyfacts, each company's 10-Q and 10-K (capital spending, FACT). Adapted by Token Runner: filtered and added up for this chart. The table, its licence and its date
How it is sourced: Derived from the event record and the filers' quarterly capital table by a stated rule; the jobs figures are Layoffs.fyi's, the capital figures the filings' own
Unit: jobs; USD billions
This table and its charts: Token Runner's own, under CC BY 4.0; the source keeps its own terms. Cite this: Token Runner, "The spine: jobs gone against capital spent, by company-year", tokenrunner.ai/esper/society/#data-gold_layoffs_spine, built 2026-10-31. CC BY 4.0.
The rows
Read from the same data file as the chart when this is opened.
Source: Layoffs.fyi's AI-attributed list, as listed, with the research join of 28 October 2026 and the relabel of 29 October 2026; SEC XBRL companyfacts, each company's 10-Q and 10-K.
Source and method
Source: Layoffs.fyi's AI-attributed list, as listed (jobs gone, REPORTED), with the research join of 28 October 2026 and the relabel of 29 October 2026 (the jobs figure tested against the company's own filing or post); SEC XBRL companyfacts, each company's 10-Q and 10-K (capital spending, FACT). Adapted by Token Runner: filtered and added up for this chart. The table, its licence and its date
How it is sourced: Derived from the event record and the filers' quarterly capital table by a stated rule; the jobs figures are Layoffs.fyi's, the capital figures the filings' own
Unit: jobs; USD billions
This table and its charts: Token Runner's own, under CC BY 4.0; the source keeps its own terms. Cite this: Token Runner, "The spine: jobs gone against capital spent, by company-year", tokenrunner.ai/esper/society/#data-gold_layoffs_spine, built 2026-10-31. CC BY 4.0.
The rows
Read from the same data file as the chart when this is opened.
Source and method
Source: Layoffs.fyi, the AI layoffs list and its monthly totals (https://layoffs.fyi/ai-layoffs/). Adapted by Token Runner: filtered and added up for this chart. The table, its licence and its date
Whose figures: According to Layoffs.fyi (https://layoffs.fyi/), which tracks tech industry layoffs.
Unit: employees
This table and its charts: Token Runner's own, under CC BY 4.0; the source keeps its own terms. Cite this: Token Runner, "All layoffs against AI-attributed layoffs, by month", tokenrunner.ai/esper/society/#data-gold_layoffs_all_monthly, built 2026-10-31. CC BY 4.0.
The rows
Read from the same data file as the chart when this is opened.
Source and method
Source: Layoffs.fyi, the AI layoffs list and its monthly totals (https://layoffs.fyi/ai-layoffs/). Adapted by Token Runner: filtered and added up for this chart. The table, its licence and its date
Whose figures: According to Layoffs.fyi (https://layoffs.fyi/), which tracks tech industry layoffs.
Unit: employees
This table and its charts: Token Runner's own, under CC BY 4.0; the source keeps its own terms. Cite this: Token Runner, "All layoffs against AI-attributed layoffs, by month", tokenrunner.ai/esper/society/#data-gold_layoffs_all_monthly, built 2026-10-31. CC BY 4.0.
The rows
Read from the same data file as the chart when this is opened.
Source: U.S. Bureau of Labor Statistics, Employment Projections, AI exposure categories, US government work, the Bureau's table as held on 2026-10-29; Microsoft Research, Working with AI, CC BY 4.0, Microsoft's table as held on 2026-10-29; joined on the SOC code by Token Runner, 2026-11-01. Licence: CC BY 4.0.
Source and method
Source: U.S. Bureau of Labor Statistics, Employment Projections, AI exposure categories (27 August 2026), US government work, the Bureau's table as held on 2026-10-29; Microsoft Research, Working with AI (Tomlinson et al., NeurIPS 2026), CC BY 4.0, Microsoft's table as held on 2026-10-29; joined on the SOC code by Token Runner, 2026-11-01. Adapted by Token Runner: filtered and added up for this chart. The table, its licence and its date
How it is sourced: BLS (public record) and Microsoft Research (CC BY 4.0); values as published, joined by code
Unit: score, 0 to 1; tier as the Bureau names it
This table and its charts: Token Runner's own, under CC BY 4.0; the source keeps its own terms. Cite this: Token Runner, "Two measures of AI exposure side by side: the Bureau's tier and Microsoft's applicability score, by occupation", tokenrunner.ai/esper/society/#data-gold_exposure_measures, built 2026-11-01. CC BY 4.0.
The rows
Read from the same data file as the chart when this is opened.
Source: U.S. Bureau of Labor Statistics, Employment Projections, AI exposure categories, US government work, the Bureau's table as held on 2026-10-29; Microsoft Research, Working with AI, CC BY 4.0, Microsoft's table as held on 2026-10-29; joined on the SOC code by Token Runner, 2026-11-01. Licence: CC BY 4.0.
Source and method
Source: U.S. Bureau of Labor Statistics, Employment Projections, AI exposure categories (27 August 2026), US government work, the Bureau's table as held on 2026-10-29; Microsoft Research, Working with AI (Tomlinson et al., NeurIPS 2026), CC BY 4.0, Microsoft's table as held on 2026-10-29; joined on the SOC code by Token Runner, 2026-11-01. Adapted by Token Runner: filtered and added up for this chart. The table, its licence and its date
How it is sourced: BLS (public record) and Microsoft Research (CC BY 4.0); values as published, joined by code
Unit: score, 0 to 1; tier as the Bureau names it
This table and its charts: Token Runner's own, under CC BY 4.0; the source keeps its own terms. Cite this: Token Runner, "Two measures of AI exposure side by side: the Bureau's tier and Microsoft's applicability score, by occupation", tokenrunner.ai/esper/society/#data-gold_exposure_measures, built 2026-11-01. CC BY 4.0.
The rows
Read from the same data file as the chart when this is opened.
Source: Challenger, Gray & Christmas, Inc., monthly Job Cuts Reports for February and April to September 2026, read 2026-10-30.
Source and method
Source: Challenger, Gray & Christmas, Inc., monthly Job Cuts Reports for February and April to September 2026 (each row names its report's address and sha256), read 2026-10-30. Adapted by Token Runner: filtered and added up for this chart. The table, its licence and its date
How it is sourced: Challenger, Gray & Christmas reports; figures as published, two months by our subtraction
Unit: job cuts announced
This table and its charts: Token Runner's own, under CC BY 4.0; the source keeps its own terms. Cite this: Token Runner, "Job cuts citing AI, by month, 2026: the Challenger reports", tokenrunner.ai/esper/society/#data-gold_challenger_ai_cuts, built 2026-10-31. CC BY 4.0.
The rows
Read from the same data file as the chart when this is opened.
Source: Challenger, Gray & Christmas, Inc., monthly Job Cuts Reports for February and April to September 2026, read 2026-10-30.
Source and method
Source: Challenger, Gray & Christmas, Inc., monthly Job Cuts Reports for February and April to September 2026 (each row names its report's address and sha256), read 2026-10-30. Adapted by Token Runner: filtered and added up for this chart. The table, its licence and its date
How it is sourced: Challenger, Gray & Christmas reports; figures as published, two months by our subtraction
Unit: job cuts announced
This table and its charts: Token Runner's own, under CC BY 4.0; the source keeps its own terms. Cite this: Token Runner, "Job cuts citing AI, by month, 2026: the Challenger reports", tokenrunner.ai/esper/society/#data-gold_challenger_ai_cuts, built 2026-10-31. CC BY 4.0.
The rows
Read from the same data file as the chart when this is opened.
Source: Pew Research Center, chart of 18 August 2026; Gallup; Reuters/Ipsos as reported by Reuters on 19 August 2025 and 10 June 2026; Pew Global, 17 September 2026, in the findings; each row names its page and sha256; read 2026-10-30.
Source and method
Source: Pew Research Center, chart of 18 August 2026 (survey of U.S. adults, 22 to 28 June 2026); Gallup (Bentley-Gallup, 4 to 11 May 2026, n 3,270, its own page); Reuters/Ipsos as reported by Reuters on 19 August 2025 and 10 June 2026 (syndicated copies); Pew Global, 17 September 2026, in the findings; each row names its page and sha256; read 2026-10-30. Adapted by Token Runner: filtered and added up for this chart. The table, its licence and its date
How it is sourced: Pew and Gallup (their own pages) and Reuters/Ipsos (as Reuters reports it); shares as published
Unit: percent of respondents
This table and its charts: Token Runner's own, under CC BY 4.0; the source keeps its own terms. Cite this: Token Runner, "Public fear of AI and jobs: Pew 2024 and 2026, Reuters/Ipsos 2025 and 2026", tokenrunner.ai/esper/society/#data-gold_public_fear_polls, built 2026-10-31. CC BY 4.0.
The rows
Read from the same data file as the chart when this is opened.
The data behind it: the 24 tables this dashboard reads, their sources and their dates
Global opinions on products and services using AI, 2022 to 2025
Global opinions on products and services using AI, 2022 to 2025. 39 rows copied as published by Stanford HAI in the AI Index Report 2026, figure 9.1.1; the numbers are Ipsos, 2022 to 2025. No value is changed and nothing is calculated.
Source: Ipsos, 2022 to 2025, as published in Stanford HAI, AI Index Report 2026, figure 9.1.1. Licence and standing: The numbers are Ipsos, 2022 to 2025; published by Stanford HAI in the AI Index Report 2026, figure 9.1.1. CC BY-ND 4.0, values copied exactly The licence: Creative Commons Attribution-NoDerivatives 4.0
One row is one row per statement and year; 39 rows; unit: share of respondents, 0 to 1. Built from: stanford-hai/opinion-9-1-1, collected 11 October 2026. Token Runner shows these values as published: none is changed and nothing is calculated from them; the source does not endorse Token Runner or this use.
Opinions about AI by country (share agreeing with each statement), 2025
Opinions about AI by country (share agreeing with each statement), 2025. 256 rows copied as published by Stanford HAI in the AI Index Report 2026, figure 9.1.3; the numbers are Ipsos, 2025. No value is changed and nothing is calculated.
Source: Ipsos, 2025, as published in Stanford HAI, AI Index Report 2026, figure 9.1.3. Licence and standing: The numbers are Ipsos, 2025; published by Stanford HAI in the AI Index Report 2026, figure 9.1.3. CC BY-ND 4.0, values copied exactly The licence: Creative Commons Attribution-NoDerivatives 4.0
One row is one row per statement and country; 256 rows; unit: share of respondents, 0 to 1. Built from: stanford-hai/opinion-9-1-3, collected 11 October 2026. Token Runner shows these values as published: none is changed and nothing is calculated from them; the source does not endorse Token Runner or this use.
Change in opinions about AI by country (share agreeing with each statement), 2024 to 2025
Change in opinions about AI by country (share agreeing with each statement), 2024 to 2025. 256 rows copied as published by Stanford HAI in the AI Index Report 2026, figure 9.1.4; the numbers are Ipsos, 2024 to 2025. No value is changed and nothing is calculated.
Source: Ipsos, 2024 to 2025, as published in Stanford HAI, AI Index Report 2026, figure 9.1.4. Licence and standing: The numbers are Ipsos, 2024 to 2025; published by Stanford HAI in the AI Index Report 2026, figure 9.1.4. CC BY-ND 4.0, values copied exactly The licence: Creative Commons Attribution-NoDerivatives 4.0
One row is one row per statement and country; 256 rows; unit: change in the share, in points of the 0 to 1 scale. Built from: stanford-hai/opinion-9-1-4, collected 11 October 2026. Token Runner shows these values as published: none is changed and nothing is calculated from them; the source does not endorse Token Runner or this use.
US perceptions of AI's societal impact: general public and experts
US perceptions of AI's societal impact: general public and experts. 20 rows copied as published by Stanford HAI in the AI Index Report 2026, figure 9.2.1; the numbers are Pew Research, 2025. No value is changed and nothing is calculated.
Source: Pew Research, 2025, as published in Stanford HAI, AI Index Report 2026, figure 9.2.1. Licence and standing: The numbers are Pew Research, 2025; published by Stanford HAI in the AI Index Report 2026, figure 9.2.1. CC BY-ND 4.0, values copied exactly The licence: Creative Commons Attribution-NoDerivatives 4.0
One row is one row per area of society and group; 20 rows; unit: per cent of respondents. Built from: stanford-hai/opinion-9-2-1, collected 11 October 2026. Token Runner shows these values as published: none is changed and nothing is calculated from them; the source does not endorse Token Runner or this use.
Views on whether AI will create or eliminate jobs: general public and experts
Views on whether AI will create or eliminate jobs: general public and experts. 8 rows copied as published by Stanford HAI in the AI Index Report 2026, figure 9.2.4; the numbers are Pew Research, 2025. No value is changed and nothing is calculated.
Source: Pew Research, 2025, as published in Stanford HAI, AI Index Report 2026, figure 9.2.4. Licence and standing: The numbers are Pew Research, 2025; published by Stanford HAI in the AI Index Report 2026, figure 9.2.4. CC BY-ND 4.0, values copied exactly The licence: Creative Commons Attribution-NoDerivatives 4.0
One row is one row per group and answer; 8 rows; unit: per cent of respondents. Built from: stanford-hai/opinion-9-2-4, collected 11 October 2026. Token Runner shows these values as published: none is changed and nothing is calculated from them; the source does not endorse Token Runner or this use.
Projected daily AI companionship adoption among US adults
Projected daily AI companionship adoption among US adults. 27 rows copied as published by Stanford HAI in the AI Index Report 2026, figure 9.2.9; the numbers are Forecasting Research Institute, 2026. No value is changed and nothing is calculated.
Source: Forecasting Research Institute, 2026, as published in Stanford HAI, AI Index Report 2026, figure 9.2.9. Licence and standing: The numbers are Forecasting Research Institute, 2026; published by Stanford HAI in the AI Index Report 2026, figure 9.2.9. CC BY-ND 4.0, values copied exactly The licence: Creative Commons Attribution-NoDerivatives 4.0
One row is one row per group of forecasters, year and percentile; 27 rows; unit: per cent of US adults. Built from: stanford-hai/opinion-9-2-9, collected 11 October 2026. Token Runner shows these values as published: none is changed and nothing is calculated from them; the source does not endorse Token Runner or this use.
Trust in AI and intentional use at work, 2025
Trust in AI and intentional use at work, 2025. 48 rows copied as published by Stanford HAI in the AI Index Report 2026, figure 9.1.10; the numbers are University of Melbourne and KPMG International, 2025. No value is changed and nothing is calculated.
Source: University of Melbourne and KPMG International, 2025, as published in Stanford HAI, AI Index Report 2026, figure 9.1.10. Licence and standing: The numbers are University of Melbourne and KPMG International, 2025; published by Stanford HAI in the AI Index Report 2026, figure 9.1.10. CC BY-ND 4.0, values copied exactly The licence: Creative Commons Attribution-NoDerivatives 4.0
One row is one row per country; 48 rows; unit: per cent of respondents. Built from: stanford-hai/opinion-9-1-10, collected 11 October 2026. Token Runner shows these values as published: none is changed and nothing is calculated from them; the source does not endorse Token Runner or this use.
Trust in the European Union, the United States, China and one's own country to regulate AI, 2025
Trust in the European Union, the United States, China and one's own country to regulate AI, 2025. 104 rows copied as published by Stanford HAI in the AI Index Report 2026, figure 9.3.2; the numbers are Pew Research, 2025. No value is changed and nothing is calculated.
Source: Pew Research, 2025, as published in Stanford HAI, AI Index Report 2026, figure 9.3.2. Licence and standing: The numbers are Pew Research, 2025; published by Stanford HAI in the AI Index Report 2026, figure 9.3.2. CC BY-ND 4.0, values copied exactly The licence: Creative Commons Attribution-NoDerivatives 4.0
One row is one row per country and regulator; 104 rows; unit: share of respondents, 0 to 1. Built from: stanford-hai/opinion-9-3-2, collected 11 October 2026. Token Runner shows these values as published: none is changed and nothing is calculated from them; the source does not endorse Token Runner or this use.
Trust in government regulation of AI by country, 2025
Trust in government regulation of AI by country, 2025. 31 rows copied as published by Stanford HAI in the AI Index Report 2026, figure 9.3.1; the numbers are Ipsos, 2025. No value is changed and nothing is calculated.
Source: Ipsos, 2025, as published in Stanford HAI, AI Index Report 2026, figure 9.3.1. Licence and standing: The numbers are Ipsos, 2025; published by Stanford HAI in the AI Index Report 2026, figure 9.3.1. CC BY-ND 4.0, values copied exactly The licence: Creative Commons Attribution-NoDerivatives 4.0
One row is one row per country and year; 31 rows; unit: share of respondents, 0 to 1. Built from: stanford-hai/opinion-9-3-1, collected 11 October 2026. Token Runner shows these values as published: none is changed and nothing is calculated from them; the source does not endorse Token Runner or this use.
Support for AI federal regulation by US state, 2025
Support for AI federal regulation by US state, 2025. 117 rows copied as published by Stanford HAI in the AI Index Report 2026, figure 9.3.5; the numbers are CHIP50, 2025. No value is changed and nothing is calculated.
Source: CHIP50, 2025, as published in Stanford HAI, AI Index Report 2026, figure 9.3.5. Licence and standing: The numbers are CHIP50, 2025; published by Stanford HAI in the AI Index Report 2026, figure 9.3.5. CC BY-ND 4.0, values copied exactly The licence: Creative Commons Attribution-NoDerivatives 4.0
One row is one row per state and answer; 117 rows; unit: share of respondents, 0 to 1. Built from: stanford-hai/opinion-9-3-5, collected 11 October 2026. Token Runner shows these values as published: none is changed and nothing is calculated from them; the source does not endorse Token Runner or this use.
The event record: AI-attributed layoffs, one row per cut
The Phase 1 event record: 222 events Layoffs.fyi attributes to AI, 2024-01-23 to 2026-10-28, one row per cut per company per announcement, with every field of the record (page 4b) and NULL where the home cannot fill it. Filled: the listed head-count on 149 rows and share on 116 (Layoffs.fyi's numbers, as reported by the one press source it names); ticker and SEC number on 103 rows at 62 companies; the company's own words, who said AI, AI's role and the label on the 53 hand-read rows; the kind of source by rule on every row (PRESS 185, COMPANY PAGE 12, FILING 11, SOCIAL 9, NOTICE 5); the month's all-layoffs totals on 222 rows. Empty on every row today: function, mechanism. The date is one unlabelled date on the listed rows; filed, WARN or memo dates on the research rows. THE RESEARCH JOIN of 28 October 2026 (filings and reports read by hand, bus 2600-2620) fills 37 listed events (the company's own figure beside the table's, denials on record, what the machine does, filing accessions) and adds 48 events the list does not hold (listed_by NULL). THE RELABEL of 29 October 2026 (the records relabel list, filings and state WARN sheets opened by hand) corrects or fills 13 rows (the old value kept on the row) and tests the company's own words against the role on 41 FUND and DID rows (words_support_role).
Source: Layoffs.fyi's AI-attributed list and its whole list by month, theirs; company names from SEC EDGAR; a hand read of the companies' own words on 28 October 2026; the research join of 28 October 2026 (filings, company pages, WARN notices and press, every value cited); the relabel of 29 October 2026 (filings, company posts and state WARN sheets opened by hand). Licence and standing: Layoffs.fyi (the lister; its numbers and its attribution); company names from SEC EDGAR; the hand read of 28 October 2026; the research join of 28 October 2026; the relabel of 29 October 2026
One row is one row per cut, per company, per announcement; 222 rows; unit: jobs. Built from: layoffs-ai/ai-layoffs, collected 28 October 2026; layoffs-ai/all-layoffs-monthly, collected 31 October 2026; company-map/companies, collected 31 October 2026. Token Runner adapted this material: it was filtered, joined and added up; the source does not endorse Token Runner or this use.
This table and its charts: Token Runner's own, under CC BY 4.0; the source keeps its own terms. Cite this: Token Runner, "The event record: AI-attributed layoffs, one row per cut", tokenrunner.ai/esper/society/#data-gold_layoffs_events, built 2026-10-31. CC BY 4.0.
The voice record: what the people say about the cuts, as codes and counts
Step 5 of the layoffs data model: 1317 observations of the staff conversation around the cuts: 178 read by the research pass of 28 October 2026 from Blind, Glassdoor and Reddit directly and from the anonymous worker accounts named outlets printed (39 via press), and 697 from the TheLayoff board study of the same morning (73 boards, 62 dated periods with a thread count, 415 cited claims). A SIGNAL table: no text, only theme codes (37 themes), the posters' stance on AI (DID 51, COVER 12, FUND 78, NEITHER 811, MIXED 150, NA 82, NOT-AI 0, FRAMING 0), whose voice (posters 964, study 282, platform 31, workers via press 26, reviewers 11, company 1, press 1, staff sources 1), dates at the precision given, and the platforms' own counts: likes, comments and views on 530 rows, the Blind monthly measure on 11 months (230 layoff posts, 18 AI-tied), early dating on 12 rows. 2 sensitive rows withheld.
Source: The research pass of 28 October 2026 on Blind, Glassdoor, Reddit and the named outlets; the TheLayoff board study of 28 October 2026 (73 boards read directly); X posts gathered by the house collector; the theme and stance codes are ours. Licence and standing: Blind, Glassdoor, Reddit and TheLayoff as read on 28 October 2026 by the research pass and the board study (counts are the platforms' own; TheLayoff thread counts are floors where capped); the anonymous accounts as the named outlets printed them; theme and stance codes are ours
One row is one row per observation: a thread or cluster of threads, a tracker entry, a page of reviews, a monthly measure, or an outlet's anonymous worker account; 1317 rows; unit: posts. Built from: layoffs-research/rows, collected 28 October 2026; company-map/companies, collected 31 October 2026; layoffs-boards/boards, collected 28 October 2026; layoffs-boards/clusters, collected 28 October 2026; layoffs-boards/claims, collected 28 October 2026. Token Runner adapted this material: it was filtered, joined and added up; the source does not endorse Token Runner or this use.
This table and its charts: Token Runner's own, under CC BY 4.0; the source keeps its own terms. Cite this: Token Runner, "The voice record: what the people say about the cuts, as codes and counts", tokenrunner.ai/esper/society/#data-gold_layoffs_voices, built 2026-10-31. CC BY 4.0.
BLS JOLTS: openings, hires and layoffs, total nonfarm and the Information sector, by month
192 rows: six JOLTS series by month, January 2024 to August 2026 (August 2026 preliminary), levels in thousands as the series give them. The Information sector is not 'tech' and says nothing about AI; a sector series, not a company one.
Source: U.S. Bureau of Labor Statistics, Job Openings and Labor Turnover Survey, through the BLS public API v1 (no key); raw answer raw/bls-jolts/2026-10-29T122018.json, sha256 2e44b8ebf403651459f1e5fdd6272f202a47e89afa7023ed96b61e314b660cfe. Licence and standing: BLS JOLTS (US government public record), fetched through the public API; levels as published
One row is one row per series per month; 192 rows; unit: thousands. Built from: not stated. Token Runner adapted this material: it was filtered, joined and added up; the source does not endorse Token Runner or this use.
This table and its charts: Token Runner's own, under CC BY 4.0; the source keeps its own terms. Cite this: Token Runner, "BLS JOLTS: openings, hires and layoffs, total nonfarm and the Information sector, by month", tokenrunner.ai/esper/society/#data-gold_bls_jolts, built 2026-10-29. CC BY 4.0.
All layoffs against AI-attributed layoffs, by month
Layoffs.fyi's monthly totals for every layoff it lists beside the AI-attributed ones, one row per month, 2024-01 to 2026-10: the denominator the AI list needs. Over the span 411,441 employees in 1348 events, of which 138,781 employees in 174 events are attributed to AI. The two share columns are our arithmetic from the source's totals; a month with no events reads NULL.
Source: Layoffs.fyi, the AI layoffs list and its monthly totals (https://layoffs.fyi/ai-layoffs/). Licence and standing: According to Layoffs.fyi (https://layoffs.fyi/), which tracks tech industry layoffs.
One row is one row per month; 34 rows; unit: employees. Built from: layoffs-ai/all-layoffs-monthly, collected 31 October 2026. Token Runner adapted this material: it was filtered, joined and added up; the source does not endorse Token Runner or this use.
This table and its charts: Token Runner's own, under CC BY 4.0; the source keeps its own terms. Cite this: Token Runner, "All layoffs against AI-attributed layoffs, by month", tokenrunner.ai/esper/society/#data-gold_layoffs_all_monthly, built 2026-10-31. CC BY 4.0.
BLS: relative AI exposure of 831 occupations, with employment, projections and median wage
831 rows: one per detailed occupation of the BLS 2025 National Employment Matrix, with BLS's relative AI exposure tier (Low, Moderate, High, Very high) and the file's employment, 2025-35 projection, openings, self-employment, median wage, education, experience and training columns as the file gives them. Employment in thousands. BLS: exposure signifies that AI could be or has been used to assist or complete some of the work in an occupation; it does not imply job loss, productivity gains, automation probability, or wage effects.
Source: U.S. Bureau of Labor Statistics, Employment Projections program, 'AI exposure categories and 2025-35 employment projections' (27 August 2026), https://www.bls.gov/emp/ind-occ-matrix/ai-exposure-categories.xlsx (method: https://www.bls.gov/emp/publications/ai-exposure-categories.htm); US government work, public domain; read 2026-10-29; raw file raw/bls-ai-exposure/2026-10-29T153355.xlsx, sha256 51f5779feea35b89d9c688970ebb9d2e03fca514b39a5100b66faa88abffb52b. Licence and standing: BLS Employment Projections, AI exposure categories (US government public record, public domain); figures as published
One row is one row per detailed occupation; 831 rows; unit: employment in thousands of jobs; wage in US dollars. Built from: not stated. Token Runner adapted this material: it was filtered, joined and added up; the source does not endorse Token Runner or this use.
This table and its charts: Token Runner's own, under CC BY 4.0; the source keeps its own terms. Cite this: Token Runner, "BLS: relative AI exposure of 831 occupations, with employment, projections and median wage", tokenrunner.ai/esper/society/#data-gold_bls_ai_exposure, built 2026-10-29. CC BY 4.0.
OMB Historical Table 2.2: the percentage composition of federal receipts by source, 1934 to 2031
990 rows: one per fiscal year per column of OMB Historical Table 2.2 (FY2027 budget), percents of total receipts; the years the table marks as estimates (2026 to 2031) are flagged.
Source: Office of Management and Budget, Historical Tables, Table 2.2, Budget of the U.S. Government, Fiscal Year 2027, https://www.whitehouse.gov/wp-content/uploads/2026/04/hist02z2_fy2027.xlsx (listed at https://www.whitehouse.gov/omb/information-resources/budget/historical-tables/); US government work; read 2026-10-29; raw file raw/omb-hist02z2/2026-10-29T173122.xlsx, sha256 9e2bc741ca3a92929551ca65c6db55901a1d96bac0cae43788c89cfac4f0fe55. Licence and standing: OMB Historical Tables (US government public record); percents as published
One row is one row per fiscal year per column; 990 rows; unit: percent of total federal receipts. Built from: not stated. Token Runner adapted this material: it was filtered, joined and added up; the source does not endorse Token Runner or this use.
This table and its charts: Token Runner's own, under CC BY 4.0; the source keeps its own terms. Cite this: Token Runner, "OMB Historical Table 2.2: the percentage composition of federal receipts by source, 1934 to 2031", tokenrunner.ai/esper/society/#data-gold_omb_receipts_by_source, built 2026-10-29. CC BY 4.0.
The WARN windows: the state lists opened, their windows and counts, and California notice by notice
408 rows: 397 California notices from the EDD sheet (sha256 df7a4d8fd0b1, fetched 2026-10-29; window 07/01/26 to 10/26/2026), five list rows (CA, WA, NY, NC, IL) with each list's address, window and counts, and six status rows (TX, CO, MA, FL, GA refused; OR not reached). The four lists other than California carry the counts of the research read of 29 October 2026 and were not fetched by this build.
Source: California EDD WARN report (Detailed WARN Report tab, https://edd.ca.gov/siteassets/files/jobs_and_training/warn/warn_report1.xlsx; sha256 df7a4d8fd0b170cb1ced6e08416efac00f266f1f58cf1bb0d641a9a1664c4db7); Washington ESD; New York DOL; NC Commerce; Illinois worknet (state public records), the four as read on 29 October 2026. Licence and standing: State WARN lists (public record of what employers filed); a notice says nothing about cause
One row is one row per state list, per status, or per California notice; 408 rows; unit: workers. Built from: not stated. Token Runner adapted this material: it was filtered, joined and added up; the source does not endorse Token Runner or this use.
This table and its charts: Token Runner's own, under CC BY 4.0; the source keeps its own terms. Cite this: Token Runner, "The WARN windows: the state lists opened, their windows and counts, and California notice by notice", tokenrunner.ai/esper/society/#data-gold_warn_windows, built 2026-10-29. CC BY 4.0.
The sites record: where the cuts landed, country and site, as the research pass found them
252 rows of (cut, country, site): 193 from file 5-GEOGRAPHY and its second pass of the research pass of 28 October 2026, and 59 state WARN rows read from the states' own lists by hand in the relabel of 29 October 2026 (California 19, Washington, New York and Illinois 40; FACT: a state record of what the company filed, which says nothing about why). 71 countries named, a site-level figure on 173 rows (jobs_gone_there_n; the rest carry the file's words and NULL), 128 rows linked to an event (derived by date within 45 days, or named by the relabel list; link_rule says which), 63 companies. Labels: REPORTED 108, FACT 100, REPORTED; CLAIM 18, NONE FOUND 10, SIGNAL 6, CLAIM 5, RUMOUR 2, — 2.
Source: WARN notices via trackers, Eurofound's restructuring monitor, Irish, Israeli and Indian press and company pages, as the research pass of 28 October 2026 read them; the California EDD, Washington ESD, New York DOL and Illinois worknet WARN lists as read by hand on 29 October 2026; company names from SEC EDGAR; the event link derived by date or named by the relabel list. Licence and standing: WARN notices, the EU restructuring monitor and named outlets as the research pass read them on 28 October 2026; the states' own WARN lists as read on 29 October 2026 (FACT rows); the event link is derived by date or named, and says which
One row is one row per cut per country per site, as the research pass found it or as a state WARN list gives it; 252 rows; unit: jobs. Built from: layoffs-research/rows, collected 28 October 2026; company-map/companies, collected 31 October 2026. Token Runner adapted this material: it was filtered, joined and added up; the source does not endorse Token Runner or this use.
This table and its charts: Token Runner's own, under CC BY 4.0; the source keeps its own terms. Cite this: Token Runner, "The sites record: where the cuts landed, country and site, as the research pass found them", tokenrunner.ai/esper/society/#data-gold_layoffs_sites, built 2026-10-31. CC BY 4.0.
Where the companies say it: the place each company's AI words appear
26 rows: one per company read by the Attribution's figures ledger and CHECK-F01, placed once at the highest place its AI words appear.
Source: Token Runner's reading of each company's filings, exhibits, posts and reported remarks; each row names its own source. Licence and standing: the companies' words as opened (FACT) or as the press reports them (REPORTED)
One row is one row per company; 26 rows; unit: companies. Built from: not stated. Token Runner adapted this material: it was filtered, joined and added up; the source does not endorse Token Runner or this use.
This table and its charts: Token Runner's own, under CC BY 4.0; the source keeps its own terms. Cite this: Token Runner, "Where the companies say it: the place each company's AI words appear", tokenrunner.ai/esper/society/#data-gold_where_companies_say_it, built 2026-10-31. CC BY 4.0.
The spine: jobs gone against capital spent, by company-year
72 company-years of the event record (companies with a ticker): the listed jobs gone that year beside the company's capital spending over the four filed quarters to the cut; 44 carry both figures. The capital rule is trailing four quarters at the cut, not the calendar year. The relabel of 29 October 2026 labels the jobs figure on the 24 largest company-years from the companies' own filings and posts (FACT 12, REPORTED 7, PRESS ONLY 5) with the company's own words beside it; capital figures to three decimals as filed.
Source: Layoffs.fyi's AI-attributed list, as listed (jobs gone, REPORTED), with the research join of 28 October 2026 and the relabel of 29 October 2026 (the jobs figure tested against the company's own filing or post); SEC XBRL companyfacts, each company's 10-Q and 10-K (capital spending, FACT). Licence and standing: Derived from the event record and the filers' quarterly capital table by a stated rule; the jobs figures are Layoffs.fyi's, the capital figures the filings' own
One row is one row per company and year of the event record; 72 rows; unit: jobs; USD billions. Built from: not stated. Token Runner adapted this material: it was filtered, joined and added up; the source does not endorse Token Runner or this use.
This table and its charts: Token Runner's own, under CC BY 4.0; the source keeps its own terms. Cite this: Token Runner, "The spine: jobs gone against capital spent, by company-year", tokenrunner.ai/esper/society/#data-gold_layoffs_spine, built 2026-10-31. CC BY 4.0.
Two measures of AI exposure side by side: the Bureau's tier and Microsoft's applicability score, by occupation
784 rows: one per 2018 SOC occupation on both gold_bls_ai_exposure and gold_ai_work_scores, the Bureau's exposure tier beside Microsoft's applicability score. Microsoft's authors: the score shows which occupations a consumer AI may be applicable to; it should not be read as measuring the ability of AI to replace jobs.
Source: U.S. Bureau of Labor Statistics, Employment Projections, AI exposure categories (27 August 2026), US government work, the Bureau's table as held on 2026-10-29; Microsoft Research, Working with AI (Tomlinson et al., NeurIPS 2026), CC BY 4.0, Microsoft's table as held on 2026-10-29; joined on the SOC code by Token Runner, 2026-11-01. Licence and standing: BLS (public record) and Microsoft Research (CC BY 4.0); values as published, joined by code The licence: Creative Commons Attribution 4.0
One row is one row per occupation (2018 SOC code) on both tables; 784 rows; unit: score, 0 to 1; tier as the Bureau names it. Built from: not stated. Token Runner adapted this material: it was filtered, joined and added up; the source does not endorse Token Runner or this use.
This table and its charts: Token Runner's own, under CC BY 4.0; the source keeps its own terms. Cite this: Token Runner, "Two measures of AI exposure side by side: the Bureau's tier and Microsoft's applicability score, by occupation", tokenrunner.ai/esper/society/#data-gold_exposure_measures, built 2026-11-01. CC BY 4.0.
Job cuts citing AI, by month, 2026: the Challenger reports
9 rows: one per month, January to September 2026, the job cuts the Challenger reports attribute to AI and the month's total.
Source: Challenger, Gray & Christmas, Inc., monthly Job Cuts Reports for February and April to September 2026 (each row names its report's address and sha256), read 2026-10-30. Licence and standing: Challenger, Gray & Christmas reports; figures as published, two months by our subtraction
One row is one row per month; 9 rows; unit: job cuts announced. Built from: not stated. Token Runner adapted this material: it was filtered, joined and added up; the source does not endorse Token Runner or this use.
This table and its charts: Token Runner's own, under CC BY 4.0; the source keeps its own terms. Cite this: Token Runner, "Job cuts citing AI, by month, 2026: the Challenger reports", tokenrunner.ai/esper/society/#data-gold_challenger_ai_cuts, built 2026-10-31. CC BY 4.0.
Public fear of AI and jobs: Pew 2024 and 2026, Reuters/Ipsos 2025 and 2026
6 rows: one per poll result, each with its question as worded, who was asked, when, and its label.
Source: Pew Research Center, chart of 18 August 2026 (survey of U.S. adults, 22 to 28 June 2026); Gallup (Bentley-Gallup, 4 to 11 May 2026, n 3,270, its own page); Reuters/Ipsos as reported by Reuters on 19 August 2025 and 10 June 2026 (syndicated copies); Pew Global, 17 September 2026, in the findings; each row names its page and sha256; read 2026-10-30. Licence and standing: Pew and Gallup (their own pages) and Reuters/Ipsos (as Reuters reports it); shares as published
One row is one row per poll result; 6 rows; unit: percent of respondents. Built from: not stated. Token Runner adapted this material: it was filtered, joined and added up; the source does not endorse Token Runner or this use.
This table and its charts: Token Runner's own, under CC BY 4.0; the source keeps its own terms. Cite this: Token Runner, "Public fear of AI and jobs: Pew 2024 and 2026, Reuters/Ipsos 2025 and 2026", tokenrunner.ai/esper/society/#data-gold_public_fear_polls, built 2026-10-31. CC BY 4.0.
Interlinked pieces that use these tables